
- This moving average can be indentify a significant area of support in an uptrend
- The confluence of the 200-day simple moving average and a major price support zone provides a low risk trading opportunity to join an uptrend
Forex traders have an overwhelming selection of indicators to choose from to help them locate a trading opportunity. Some of these brand new indicators are costly and promise to be the “Holy Grail”. Others are free and not so new but have withstood the test of time. One such indicator is the 200-day simple moving average (SMA).
Since there are roughly 200 trading days in a year, a currency that is trading above its average 200 SMA is considered bullish. It can also be simply used to find major support so traders can enter an uptrend with an excellent risk to reward ratio.
Learn Forex: NZDUSD 200-Day Simple Moving Average Bounce
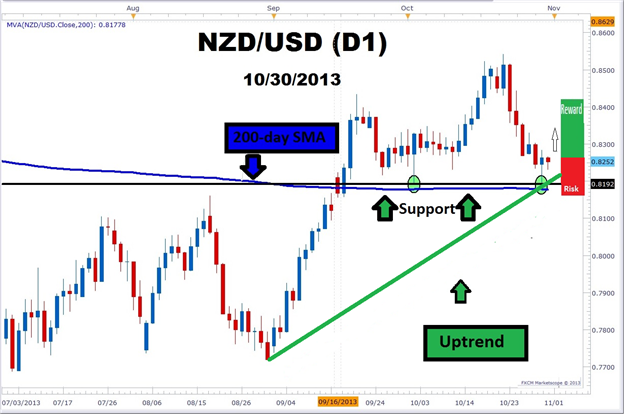
(Chart Created using Marketscope 2.0 charts)
In the example above, we can see a strong uptrend in the daily NZDUSD chart. The trend started at the end of August at 0.7718 from below the 200-day simple moving average crossed above the 200-SMA on 9/16 and reached a high of 0.8434 on 9/19. Traders who missed the over 700 pip move had a second chance to join this powerful trend as NZDUSD retraced back and bounced from the blue 200-day simple moving average in the 0.8200 neighborhood.
In Forex, numbers ending in “00” usually act as significant areas of support and resistance as well. The confluence of these two factors gave traders added confidence in a resumption of the trend. From the rebound on 10/2, NZDUSD did not disappoint as the bulls as price pushed up over 300 pips higher topping out at 0.8543 on 10/22.
However, nothing moves in a straight line forever including NZDUSD. But after a 300 pip decline, NZDUSD has just rebounded from its 200-day simple moving average (0.8177) and prior round number support at 0.8200. This setup could be a replay of the 10/2 rally and the 200-day simple moving average is about 80 pips away with the old 9/19 high at 0.8434 is 182 pips away.
In sum, the confluence of an uptrend line, round number support and our old friend, the 200-day simple moving average point give traders a good 1:2 risk to reward setup. Traits of Successful Traders research by FXCM of over 12 million real trades by clients worldwide in 2009 and 2010 revealed that the number one mistake that traders made was not using a minimum of a 1:2 risk/reward ratio.
Locating where price is in relation to the 200-day simple moving average can help Forex traders find entries that have a greater chance of making more money than the amount placed at risk.
Source: http://dld.bz/cTvMQ
No comments:
Post a Comment