Friday 30 August 2013

USDCAD Eyes Fresh Highs as 2Q GDP Highlights Slowing Recovery

Trading the News: Canada Gross Domestic Product

The slowing recovery in Canada may prompt a further selloff in the Canadian dollar as it dampens the Bank of Canada’s (BoC) scope to normalize monetary policy.
What’s Expected:

Time of release: 08/30/2012 12:30 GMT, 8:30 EDT

Primary Pair Impact: USDCAD
Expected: 1.6%
Previous: 2.5%
DailyFX Forecast: 1.2% to 1.8%

Why Is This Event Important:
Indeed, concerns of a more pronounced slowdown in the real economy may push BoC Governor Stephen Poloz to adopt a more dovish tone for monetary policy, and the central bank may retain its currency policy for an extended period of time in an effort to address the downside risks surrounding the region.

Expectations: Bearish Argument/Scenario

Release
Expected
Actual
Retail Sales (MoM) (JUN)
-0.4%
-0.6%
Wholesale Trade Sales (MoM) (JUN)
-0.5%
-2.8%
Net Change in Employment (JUL)
10.0K
-39.4K

The ongoing weakness in the labor market along with the slowdown in private sector consumption may produce a dismal GDP report, and the Canadian dollar may face additional headwinds over the remainder of the year should the data curb expectations for a BoC rate hike.

Risk: Bullish Argument/Scenario

Release
Expected
Actual
Existing Home Sales (MoM) (JUL)
--
0.2%
Housing Start (JUL)
190.0K
192.9K
New Housing Price Index (MoM) (JUN)
0.1%
0.2%

Nevertheless, the strength in the housing market may help to limit the scope of seeing a marked slowdown in the exchange rate, and a positive print may foster a near-term correction in the USDCAD as it raises the fundamental outlook for the Canadian dollar.

How To Trade This Event Risk(Video)
Bearish CAD Trade: 2Q GDP slows to 1.6% or lower
  • Need green, five-minute candle following the release to consider buy entry on USDCAD
  • If the reaction favors a long trade, enter with two position
  • Place stop at the near-by swing low/reasonable distance from cost; at least 1:1 risk-to-reward
  • Shift stop to entry on remaining position once initial target is hit, set reasonable limit
Bullish CAD Trade: Growth rate tops forecast
  • Need red, five-minute candle to look at a short USDCAD trade
  • Implement the same strategy as the bearish CAD trade, just in reverse
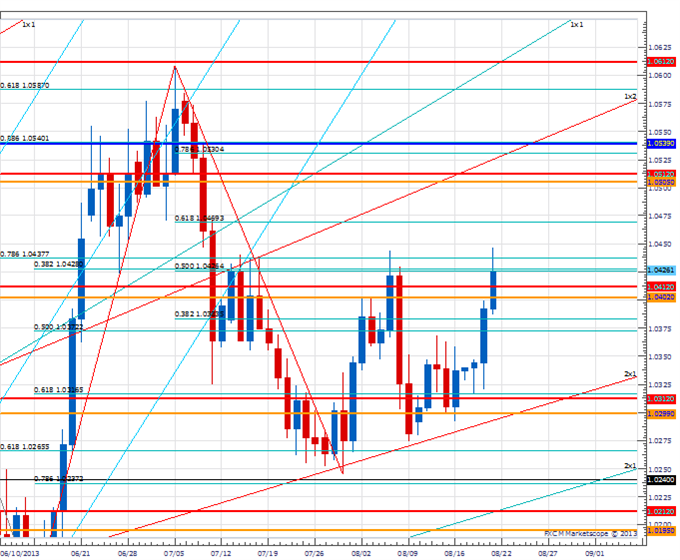
Potential Price Targets For The Release

Forex_USDCAD_Eyes_Fresh_Highs_as_2Q_GDP_Highlights_Slowing_Recovery_body_ScreenShot041.png, USDCAD Eyes Fresh Highs as 2Q GDP Highlights Slowing Recovery
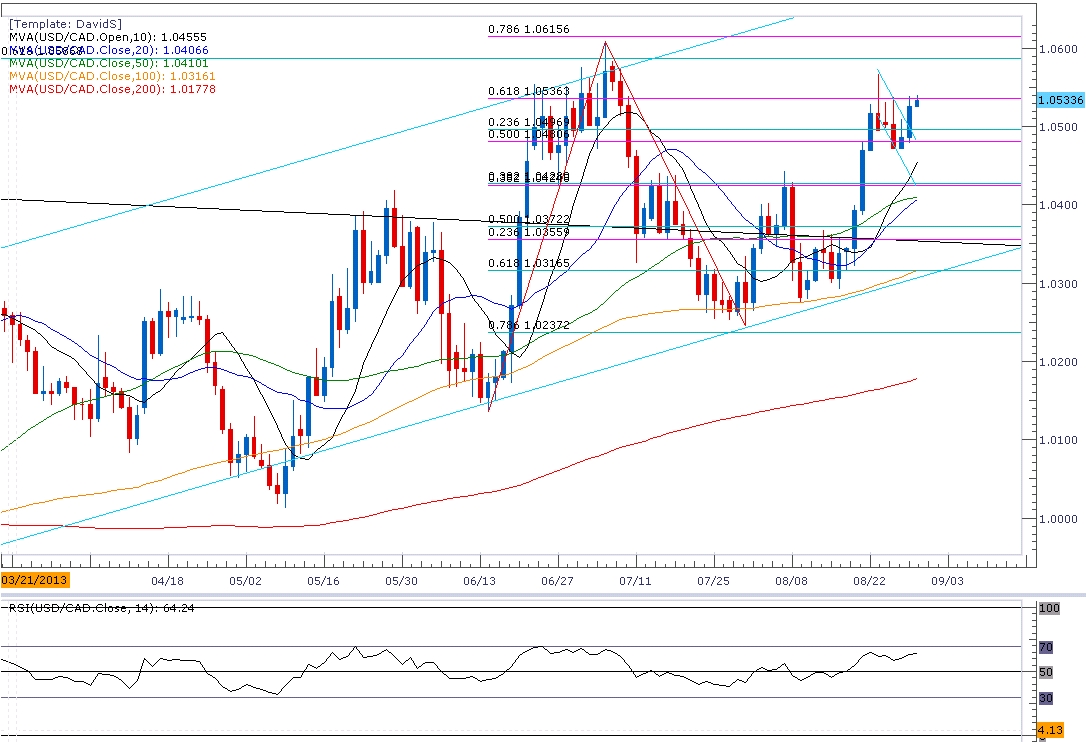
  • Upward trending channel calls for higher high; bullish flag formation in focus
  • Soft resistance at 1.0540-50, 61.8% expansion; close above brings 78.6% Fib expansion on radar
  • Relative Strength Index approaching overbought territory
  • Former resistance (1.0420-30, 38.2% retracement) seen as new support
Impact that the Gross Domestic Product report has had on CAD during the last quarter

Period
Data Released
Estimate
Actual
Pips Change
(1 Hour post event )
Pips Change
(End of Day post event)
1Q 2013
05/31/2013 12:30 GMT
2.3%
2.5%
+12
+36

1Q 2013 Canada Gross Domestic Product

Forex_USDCAD_Eyes_Fresh_Highs_as_2Q_GDP_Highlights_Slowing_Recovery_body_ScreenShot040.png, USDCAD Eyes Fresh Highs as 2Q GDP Highlights Slowing Recovery

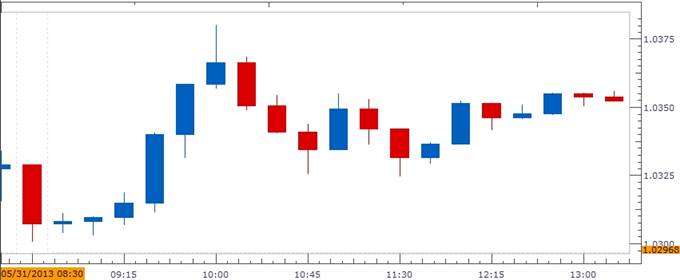
The Canadian economy grew another 2.5% in the first quarter to mark the fastest pace of growth since 2011, and the pickup in GDP may encourage the Bank of Canada to adopt a more hawkish tone for monetary policy as the central bank looks to avert an asset bubble. Despite the better-than-expected print, the initial decline in the USDCAD was short-lived, and the Canadian dollar continued to lose ground throughout the North American trade as the pair closed at 1.0364.

Source: http://dld.bz/cNTez 

Thursday 29 August 2013

3 Steps to Buy the Dip or Sell the Rally

Humans love to buy stuff on sale whether it is a bicycle, milk, a home, or insurance. Financial markets are no different. When something you considered purchasing yesterday is now available at a cheaper price, many people typically become excited about the opportunity at hand.

Today, we will cover a 3 step process to determine the timing of when to buy the dip or sell the rally in Forex.
  1. Determine trend direction
  2. Pick your favorite oscillator
  3. Filter your signals in the direction of the trend
3_Steps_to_Buy_the_Dip_or_Sell_the_Rally_body_Picture_2.png, 3 Steps to Buy the Dip or Sell the Rally

Determine Trend Direction
Trend trading is one of the most widely followed Forex strategies used by new and experienced traders. This is for many reasons including Forex trends tend to last a while and you have more pips available in the direction of the trend than against the trend.

Stand back for your chart and identify which direction the prices are generally moving. Make this step so easy that a 10 year old child can do it consistently.

There are other techniques involving Forex technical analysis such as determining a series of higher highs and higher low or using simple moving averages. All are valid methods of trend identification.

When you understand the benefits of trend trading, you will realize that Forex trading can be made easier with some simple strategies.

Pick Your Favorite Indicator

There are many tools to help traders identify potential reversal points in a market. Four highly effective trading indicators that every trader should be familiar with includes the Simple Moving Average, RSI (Relative Strength Index), Stochastic, and MACD (Moving Average Convergence Divergence).

Once you have identified a strong trending market, apply the RSI, Stochastic, MACD indicator to your chart.

No need to apply all of these indicators. You only need one of them. Pick the indicator based on your personal preference and the one you are most comfortable with reading its signals.

Filter Your Signals in the Direction of the Trend

Since most pips are available in the direction of the trend, it would make sense to trade only those signals that generate in the direction of our trend. One of the useful tools to identifying overbought and oversold levels is the Relative Strength Index (RSI).

For example, if the trend is strong to the upside, then we want to take only oversold signals from RSI and ignore overbought signals. Buying oversold signals aligns us with the direction of an uptrend.

Forex Strategy: Buying Dips and Selling Rallies

3_Steps_to_Buy_the_Dip_or_Sell_the_Rally_body_Picture_1.png, 3 Steps to Buy the Dip or Sell the Rally


Also, the oversold signal in an uptrend should act like a beach ball being held underwater. Meaning, once the oversold pressure is relieved, prices should pop up quickly. That is the position we want to be in to trade this ‘pop’ higher if the trend is up.

The opposite would be true in a downtrend where we look only for overbought levels and ignore oversold levels.

Conclusion

Filtering your trades in the direction of the trend is a critical element to improving the probability of consistent results. Remember, only buy in an uptrend and sell only in a downtrend.

Following this easy 3 step process will allows you to identify trading opportunities. The next part of the equation is to then determine your trade size. For more on that, follow this 3 step guide to determine your trade size.

Source: http://dld.bz/cNQP7 

Forex Strategy Video: EURUSD Flashing Breakout Warnings


EURUSD has proven surprisingly stable over the past few weeks despite tumult seen in other benchmarks like the US equity indexes and the yen crosses. That stability may ultimately prove complacency however which sets the pair on a countdown to a return to 'normal' - or in trader vernacular: 'it's a breakout risk'. We discuss the evidence of the breakout threat - from the technical congestion patterns to the extreme drop in implied volatility - along with what catalysts to watch and strategy to use in today's Forex Strategy video.

Source: http://dld.bz/cNQMc 

Know Which Trends to Trade

Each week Forex scalpers are charged with a variety of important decisions to make. Probably one of the most difficult is finding which currency pairs are best suited for trading. Strong trends are preferable for scalping because one a trend is found, traders can decide their preference to buy or sell a specific currency pair. Today we will review how to simplify this determination by using a series of trend and momentum analysis techniques.

Learn Forex –EURNZD 4Hour Trend
Know_Which_Trends_to_Trade_body_Picture_1.png, Know Which Trends to Trade


Above we can see the strong uptrend being played out on the EURNZD. Over the past 10 days the pair has been easily cruising to higher highs, advancing over 949 pips from its monthly low at 1.6325. To identify the optimal trading scenario for uptrends like the EURNZD , traders can also look for a series of higher lows and higher highs on shorter term charts.

Below we can see the EURNZD divided into a series of trading blocks. These pricing blocks have been created using a 30min graph, using the techniques discussed in a previous Trend of the Day Article, The Midweek Trend Review. With both blocks heading higher this is normally a signal of a strong Forex trend. However, many traders may find themselves indecisive on the EURNZD with current price action declining during today’s trading. Which begs the question if scalpers should still be looking to buy the EURNZD.

Learn Forex –EURNZD Building Blocks
Know_Which_Trends_to_Trade_body_Picture_3.png, Know Which Trends to Trade


One advantage of using the blocking method is that the previous highs and lows will have already been marked on your graph. Above we can see that price has yet to descend below the previous low at 1.6989. In the absence of new lows, traders can reasonably assume that a new downtrend is not developing.

With this in mind, traders can proceed to patiently look for momentum to return to the EURNZD before perusing fresh scalping opportunities. In the event price does decline under the previous low, this would be a strong signal that our trend has at least temporarily ended allowing traders to pursue other opportunities and currency pairs.     

Source: http://dld.bz/cNQKh 

Wednesday 28 August 2013

Trade Update - Breakout Trading Now Attractive in Key FX Pairs

On Monday we wrote that we remained mostly in “wait and see” mode on the US Dollar as low volatility and tight trading ranges meant the next Greenback move was unclear.

Yet we’ve seen forex vols bounce noticeably and this may be the start of the move we’ve expected.

Forex Volatility Prices Have Bounced Noticeably off of Recent Lows

forex_trade_update_us_dollar_breakout_trading_body_Picture_1.png, Trade Update - Breakout Trading Now Attractive in Key FX Pairs

If you’ve never followed along with our sentiment-based trading systems, you can view this video to find out more about automating our proprietary strategies.

Regular viewers will note that our strategy biases (see table below) on the Australian Dollar and other pairs have shifted on the sudden bounce in volatility, and indeed we now think the Breakout 2 strategy is now attractive.

For other pairs we’ll stick to what has worked as of late, but a bigger move in vols would make us change our biases on other US Dollar pairs as well.

DailyFX Individual Currency Pair Conditions and Trading Strategy Bias

forex_trade_update_us_dollar_breakout_trading_body_Picture_2.png, Trade Update - Breakout Trading Now Attractive in Key FX Pairs

Definitions

Volatility Percentile – The higher the number, the more likely we are to see strong movements in price. This number tells us where current implied volatility levels stand in relation to the past 90 days of trading. We have found that implied volatilities tend to remain very high or very low for extended periods of time. As such, it is helpful to know where the current implied volatility level stands in relation to its medium-term range.

Trend – This indicator measures trend intensity by telling us where price stands in relation to its 90 trading-day range. A very low number tells us that price is currently at or near 90-day lows, while a higher number tells us that we are near the highs. A value at or near 50 percent tells us that we are at the middle of the currency pair’s 90-day range.

Range High – 90-day closing high.
Range Low – 90-day closing low.
Last – Current market price.

Bias – Based on the above criteria, we assign the more likely profitable strategy for any given currency pair. A highly volatile currency pair (Volatility Percentile very high) suggests that we should look to use Breakout strategies. More moderate volatility levels and strong Trend values make Momentum trades more attractive, while the lowest Vol Percentile and Trend indicator figures make Range Trading the more attractive strategy.

HYPOTHETICAL PERFORMANCE RESULTS HAVE MANY INHERENT LIMITATIONS, SOME OF WHICH ARE DESCRIBED BELOW. NO REPRESENTATION IS BEING MADE THAT ANY ACCOUNT WILL OR IS LIKELY TO ACHIEVE PROFITS OR LOSSES SIMILAR TO THOSE SHOWN. IN FACT, THERE ARE FREQUENTLY SHARP DIFFERENCES BETWEEN HYPOTHETICAL PERFORMANCE RESULTS AND THE ACTUAL RESULTS SUBSEQUENTLY ACHIEVED BY ANY PARTICULAR TRADING PROGRAM.
ONE OF THE LIMITATIONS OF HYPOTHETICAL PERFORMANCE RESULTS IS THAT THEY ARE GENERALLY PREPARED WITH THE BENEFIT OF HINDSIGHT. IN ADDITION, HYPOTHETICAL TRADING DOES NOT INVOLVE FINANCIAL RISK, AND NO HYPOTHETICAL TRADING RECORD CAN COMPLETELY ACCOUNT FOR THE IMPACT OF FINANCIAL RISK IN ACTUAL TRADING. FOR EXAMPLE, THE ABILITY TO WITHSTAND LOSSES OR TO ADHERE TO A PARTICULAR TRADING PROGRAM IN SPITE OF TRADING LOSSES IS MATERIAL POINTS WHICH CAN ALSO ADVERSELY AFFECT ACTUAL TRADING RESULTS. THERE ARE NUMEROUS OTHER FACTORS RELATED TO THE MARKETS IN GENERAL OR TO THE IMPLEMENTATION.


OF ANY SPECIFIC TRADING PROGRAM WHICH CANNOT BE FULLY ACCOUNTED FOR IN THE PREPARATION OF HYPOTHETICAL PERFORMANCE RESULTS AND ALL OF WHICH CAN ADVERSELY AFFECT ACTUAL TRADING RESULTS. 

Any opinions, news, research, analyses, prices, or other information contained on this website is provided as general market commentary, and does not constitute investment advice. The FXCM group will not accept liability for any loss or damage, including without limitation to, any loss of profit, which may arise directly or indirectly from use of or reliance contained in the trading signals, or in any accompanying chart analyses.

Source: http://dld.bz/cNM8t 

Tuesday 27 August 2013

USD Coiling Up Amid Month-End Flows, Waiting to Sell JPY

TheDow Jones-FXCM U.S. Dollar Index failed to benefit from the positive data coming out of the U.S. economy, while the Japanese Yen is gaining ground across the board.

Index
Last
High
Low
Daily Change (%)
Daily Range (% of ATR)
DJ-FXCM Dollar Index
10723.31
10762.59
10717.37
-0.09
82.49%

USDOLLAR 30-Minute
Forex_USD_Coiling_Up_Amid_Month-End_Flows_Waiting_to_Sell_JPY_body_ScreenShot016.png, USD Coiling Up Amid Month-End Flows, Waiting to Sell JPY

  • 50.0 percent Fibonacci expansion (10,708) continues to provide support
  • Remains capped by 61.8 percent expansion (10,764)
  • 30-minute Relative Strength Index bounces back ahead of oversold
  • Major resistance: 10,803 (38.2 retracement) - 10,806 (78.6 expansion)
Release
GMT
Expected
Actual
S&P/Case-Shiller US Home Price Index (2Q)
13:00
--
10.08%
S&P/Case-Shiller US Home Price Index (YoY) (2Q)
13:00
--
146.32
S&P/Case-Shiller Composite-20 s.a. (MoM) (JUN)
13:00
1.00%
0.89%
S&P/Case-Shiller Composite-20 (YoY) (JUN)
13:00
12.10%
12.07%
S&P/Case-Shiller Home Price Index (JUN)
13:00
159.30
159.54
Richmond Fed Manufacturing Index (AUG)
14:00
0
14
Consumer Confidence (AUG)
14:00
79.0
81.5

The Dow Jones-FXCM U.S. Dollar Index (Ticker: USDollar) gave back the overnight advance to 10,762 despite the slew of positive developments coming out of the U.S. economy, and month-end flows may keep the greenback range-bound during the final days of August as market participants weigh the outlook for monetary policy.

The dollar should continue to carve a near-term base above the 50.0 percent Fibonacci expansion (10,708) as the Federal Reserve looks to move away from its easing cycle, and we may see a short-term rebound over the next 24-hours of trading as the 30-minute relative strength index holds above oversold territory. In turn, we will maintain our game plan of buying dips in the greenback, and the bullish sentiment surrounding the reserve currency looks poised to gather pace as the FOMC stands ready to switch gears later this year.

USDOLLAR Daily
Forex_USD_Coiling_Up_Amid_Month-End_Flows_Waiting_to_Sell_JPY_body_ScreenShot018.png, USD Coiling Up Amid Month-End Flows, Waiting to Sell JPY

With the ongoing discussion at the FOMC to taper the asset-purchase program, San Francisco Fed President John Williams warned about the challenges in normalizing monetary policy, and went onto say that central bank policy will continue to be stimulate even after the committee halts its quantitative easing program.

Indeed, there appears to be greater consensus amongst Fed officials to slowly move away from the easing cycle, and the dollar should continue to carve a series of higher highs paired with higher lows amid the shift in the policy outlook. The USDOLLAR looks to be coiling up for a move higher as the relative strength index breaks out of the downward trend, and may make another run at the 11,000 handle as the FOMC scales back its willingness to expand the balance sheet further.

Forex_USD_Coiling_Up_Amid_Month-End_Flows_Waiting_to_Sell_JPY_body_ScreenShot020.png, USD Coiling Up Amid Month-End Flows, Waiting to Sell JPY

USDJPY Daily
Forex_USD_Coiling_Up_Amid_Month-End_Flows_Waiting_to_Sell_JPY_body_ScreenShot019.png, USD Coiling Up Amid Month-End Flows, Waiting to Sell JPY
  • Stuck in consolidation phase; waiting for a breakout
  • RSI maintains bearish trend; topside break to provide trigger
  • Soft Support: 23.6 percent retracement (96.10-20)
  • Capped by 23.6 percent expansion (99.10-20)
Two of the four components rallied against the dollar, led by a 1.22 percent advance in the Japanese Yen, and the low-yielding currency may continue to strengthen against its major counterparts as market sentiment falters.

Despite the uncertainties surrounding the fiscal outlook, it seems as though the new government is confident that the economy will be able to weather the first sales-tax hike in 15-years, and the Yen may track higher going into September as Japanese policy makers turn increasingly upbeat towards the economy.

Nevertheless, as the USDJPY continues to trade within the wedge/triangle formation, we should see a resumption of the bullish trend from earlier this year, and the near-term correction may offer a buying opportunity as the pair appears to have carved a higher low in August.

Source: http://dld.bz/cNGHf 

Wednesday 21 August 2013

Price & Time: Stocks Nearing An Important Cyclical Crossroads

EUR/USD takes out the 2Q13 high while NZD/USD fails at an important Gann line. S&P 500 nearing a short-term cyclical inflection point.

Foreign Exchange Price & Time at a Glance:
Price & Time Analysis: EUR/USD
PT_spx_body_Picture_4.png, Price & Time: Stocks Nearing An Important Cyclical Crossroads
  • EUR/USD surpassed the 2Q13 high on Tuesday, but so far follow through has been limited
  • While over 1.3220 our near-term trend bias will remain higher in the exchange rate
  • A convincing close over 1.3415 is required to shift the broader trend to positive and set up a more important advance in the weeks ahead
  • The first half of next week is a medium-term cycle turn window
  • Intermediate support is seen around 1.3300, but only weakness below 1.3220 undermines the positive structure in the Euro
EUR/USD Strategy: Still square. Need to see a more convincing close over 1.3415.
Instrument
Support 2
Support 1
Spot
Resistance 1
Resistance 2
EUR/USD
*1.3220
1.3300
1.3385
*1.3415
1.3480
Price & Time Analysis: USD/CAD
PT_spx_body_Picture_3.png, Price & Time: Stocks Nearing An Important Cyclical Crossroads
  • USD/CAD has moved steadily higher since finding support a couple of weeks ago near the 2x1 Gann angle line of the 2012 low
  • Subsequent strength back through 1.0380 has shifted our near-term trend bias back to positive
  • The 1.0440 area remains an important upside pivot with traction above required to trigger a more important move higher in Funds
  • However, a medium-term cycle turn window is seen around the end of the week
  • The 3rd square root progression of the year’s high near 1.0310 is key support and only weakness below this level will turn us negative on USD/CAD
USD/CAD Strategy: Like small longs while above 1.0310.
Instrument
Support 2
Support 1
Spot
Resistance 1
Resistance 2
USD/CAD
*1.0310
1.0370
1.0425
*1.0440
1.0500
Price & Time Analysis: NZD/USD
PT_spx_body_Picture_2.png, Price & Time: Stocks Nearing An Important Cyclical Crossroads

  • NZD/USD traded to its highest level since late May on Monday before encountering resistance near the 2x1 Gann angle line of the year’s closing high in the .8150 area
  • While over .7860 our near-term trend bias will remain higher in the Kiwi
  • The .8030 Gann level is a near-term pivot, but traction over .8150 is really needed to signal that a more important move higher is underway
  • A minor turn window is seen on Thursday and Friday
  • A close below .7860 would undermine the burgeoning positive tone and turn us negative on the Bird
NZD/USD Strategy: If the Kiwi is going to turn higher it should happen in the next couple of days. Like buying on weakness into Friday.
Instrument
Support 2
Support 1
Spot
Resistance 1
Resistance 2
NZD/USD
*0.7860
0.7900
0.7930
0.8030
*0.8150
Focus Chart of the Day: S&P 500
PT_spx_body_Picture_1.png, Price & Time: Stocks Nearing An Important Cyclical Crossroads

The early August cycle turn window in the S&P 500 that we have been monitoring has proven formidable. Last week’s beak of the July 26th 1675 low was significant from both a price & time perspective and the impulsive decline on its breach seems to further prove its importance. There is now a *possibility* that the index will embark on a greater corrective process in the weeks ahead. Information on just how important this decline really is should be gleaned over the next few days. We say this because the next or so is cyclically positive for the index. Continued weakness during this time would be a sign of a strong short-term downtrend. The more important date, however, looks to be around the middle of next week. There is a medium-term cycle turn window due around this time and if this move lower has just been a ‘run of the mill' correction within a broader uptrend then this is where is should attempt to turn higher. Failure to do so, on the other hand, will be very bearish indeed. 

Source: http://dld.bz/cNhX7