
Focus Chart of the Day: EUR/GBP
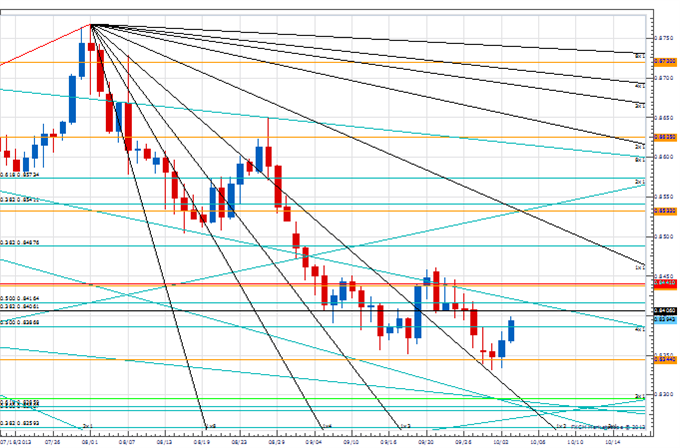
The decline from the early August of .8768 is 45 (trading) days old today. In several of his writings, WD Gann remarked that persistent trends in commodities (or in his case currencies) often terminate around 45 days. Analysts after Gann have dubbed this interval the “Gann Death Zone”. The trend in EUR/GBP over the past couple of months has certainly been persistent with only two minor corrections witnessed during that span. With the cross testing a major support area in the form of the 5th square root progression of the year’s high there looks to be plenty of potential for some sort of counter trend move in the days ahead. A close over .8400 would be initial confirmation. Weakness back under .8345, on the other hand, would warn the cross is set to fall towards downside attractions at .8285.
Foreign Exchange Price & Time at a Glance:
Price & Time Analysis: USD/JPY
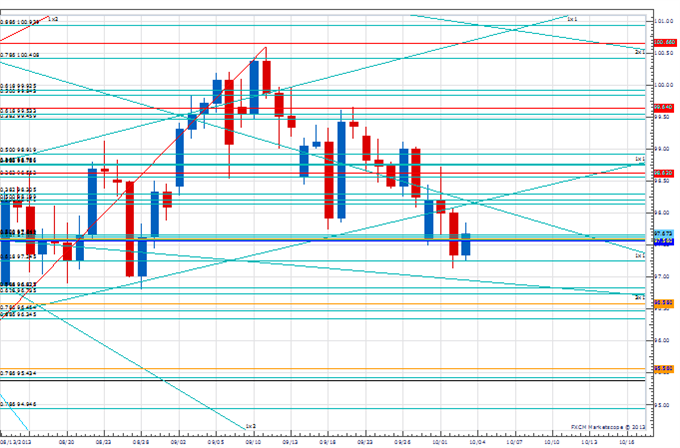
- USD/JPY broke below important Gann support at 97.50 on Wednesday to trade to its lowest level in over a month
- Our near-term trend bias is now lower in the exchange rate
- Further weakness below the 61.8% retracement of the June to July advance at 96.75 is really needed to confirm that a more important decline is underway
- Caution is required here as the next two days are a very clear cycle turn window
- Back above the 1x1 Gann line of the year’s high at 98.25 would relieve some pressure, but only over Gann resistance at 98.65 would turn us positive again on the rate
EUR/USD Strategy: Broke key support but too close to the turn window. We like being square for a couple of days as it plays out.
Instrument
|
Support 2
|
Support 1
|
Spot
|
Resistance 1
|
Resistance 2
|
USD/JPY
|
*96.75
|
97.20
|
97.65
|
98.25
|
*98.65
|
Price & Time Analysis: USD/CHF
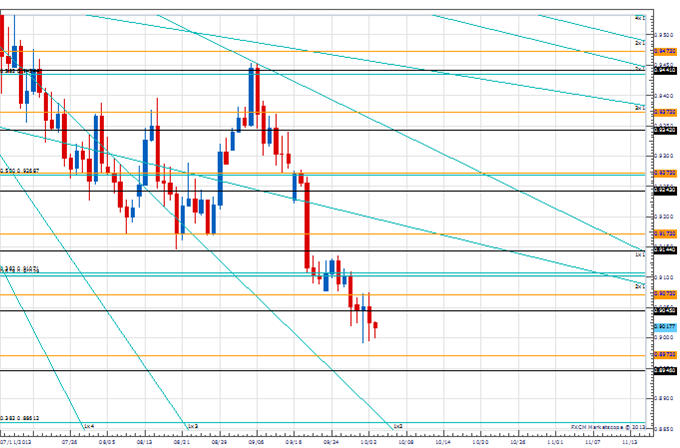
- USD/CHF closed at its lowest level since March of last year on Wednesday
- Our near-term trend bias remains lower in the exchange rate while below Gann resistance at .9070
- Focus currently is on the 9th square root progression of the year’s high at .8950 with a move below needed to expose important downside attractions at .8860
- The short-term cyclical picture has become very muddled with yesterday’s weakness
- Only a move over .9070 on a daily close basis would turn us positive on USD/CHF
USD/CHF Strategy: Like the short side while below .9070.
Instrument
|
Support 2
|
Support 1
|
Spot
|
Resistance 1
|
Resistance 2
|
USD/CHF
|
*0.8945
|
0.8970
|
0.9015
|
*0.9070
|
0.9105
|
Price & Time Analysis: USD/CAD
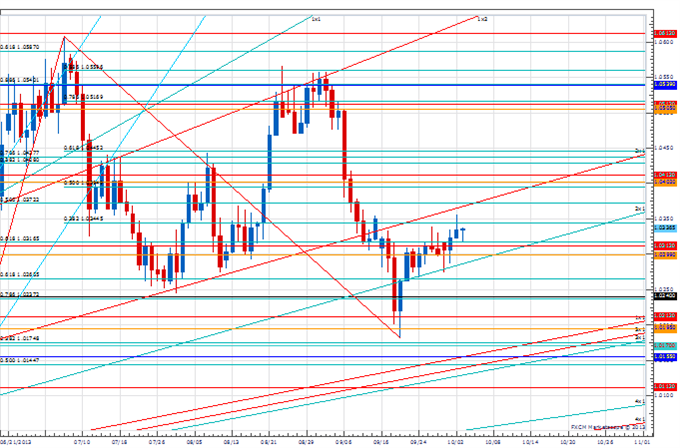
- USD/CAD has moved steadily higher since finding support near the 4th square root progression of the year’s high near 1.0195 a couple of weeks ago
- Strength through Gann resistance near 1.0300 has shifted our near-term trend bias to positive in Funds
- The 38% retracement of the July to September decline at 1.0345 is a clear upside pivot with traction above needed to prompt a a move towards upside attractions just above 1.0400
- The end of the week is a minor cycle turn window in the rate
- Weakness below long-term Fibonacci support at 1.0265 would turn us negative on Funds
USD/CAD Strategy: Looking to buy on weakness.
Instrument
|
Support 2
|
Support 1
|
Spot
|
Resistance 1
|
Resistance 2
|
USD/CAD
|
1.0215
|
*1.0265
|
1.0340
|
*1.0345
|
*1.0405
|
Source: http://dld.bz/cRGFk
No comments:
Post a Comment