Trading the Forex market entails taking a stance on two currencies simultaneously
Traders are best served by focusing on matching a strong currency with a weak currency
We cover two different ways traders can perform this analysis: Advanced, and Easy
We’ve all been there.
Cash is sitting idle in the account, and the market is moving – it’s just that we can’t find anything to trade…
This happens regardless of the market you’re in. If you’re a stock trader, well right now would be a fairly logical time to have that vantage point. While stock indexes sit at all-time highs, economic data continues to show massive weakness (hence the $85 billion capital injections that have been required JUST to prevent a major meltdown). This isn’t exactly an environment that is ‘easy’ to trade if you’re focusing on stocks and using any element of prudence in your analysis.
The Forex market can present some compelling advantages; not only in this environment but quite a few others.
You see, in stocks – there is really just two ways to trade; you either buy or sell.
Have an opinion on Apple? Ok, great – you can buy it or you can sell it. Matters are pretty simple. Same goes for any other stock that’s listed on one of the major exchanges. You can buy stocks fairly easily; and if you can find a broker to let you borrow shares, you should be able to sell it pretty easily.
In the Forex market, one of the greatest benefits is also one of the most difficult things for new traders to grasp.
Forex Lesson: Realize what you’re trading, and focus appropriately
Every trade-able asset has two sides in the FX market, and each of those two sides has two ‘scenarios (strength or weakness in each of the two currencies in the pair).’
If trading EUR/USD, you have to ask yourself…
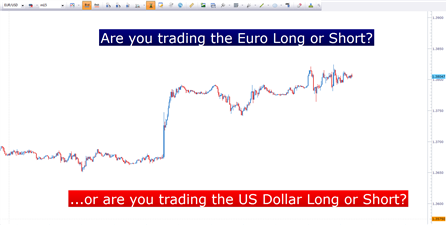
Created with Marketscope/Trading Station II
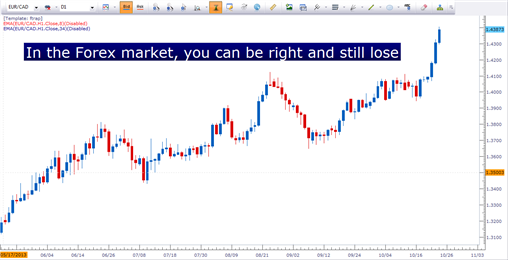
Meaning, it’s not as simple as saying ‘The Euro looks weak, I want to sell it.’ Because you can get into a trade selling the Euro and if it doesn’t get weaker than the currency you matched it up with – you will lose. You will lose, even though your analysis in expecting weakness in the Euro was correct.
Created with Marketscope/Trading Station II
Let’s look at an example to illustrate this point.
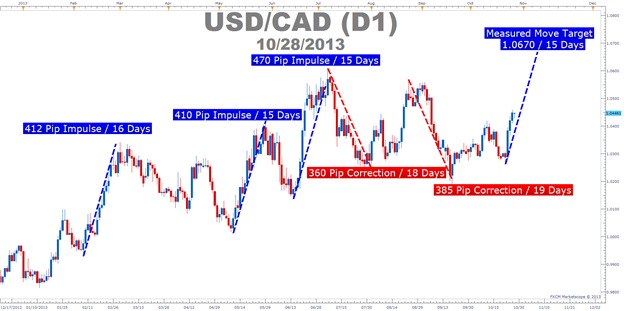
Let’s say that you decide you want to sell the Euro as you’re expecting additional weakness, and you match it up with the Canadian Dollar. So, you trigger the short EURCAD position, and look for the pair to trade lower. This means that you are short Euros, and long Canadian Dollars.
Perhaps, at first – the trade moves in your favor; only to be followed by news out of Canada that sparks even more weakness in the CAD than what was being seen in the Euro.
So, the Euro can still be getting weaker against US Dollars, and Australian Dollars, and even British Pounds… but if it’s not getting weaker against Canadian Dollars, well it doesn’t even really matter. Because you will lose on your trade and there isn’t much you can do about it.
Let’s flip this example around to see how this can actually be beneficial to traders…
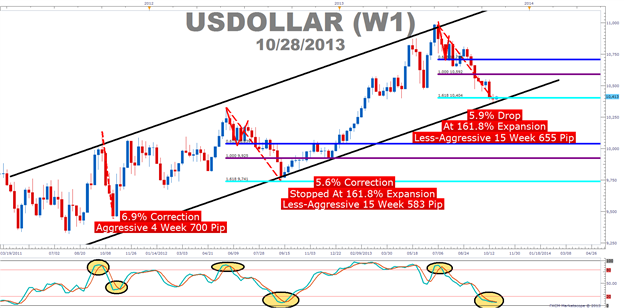
Same example, you want to sell the Euro because you expect it to get weaker; but this time, you take matters a step further and you analyze the market to see what currency has been really strong. And in your analysis, you notice that the Japanese Yen has been one of the strongest currencies in the market.
So, rather than taking the EURCAD short position and hoping that it works out, you match up what you feel will be a weak Euro, with what has recently shown strength in the Japanese Yen.
Now, this doesn’t eliminate the risk of taking a loss; but it can assist in moving the probabilities in your favor based on what has been exhibited in the marketplace.
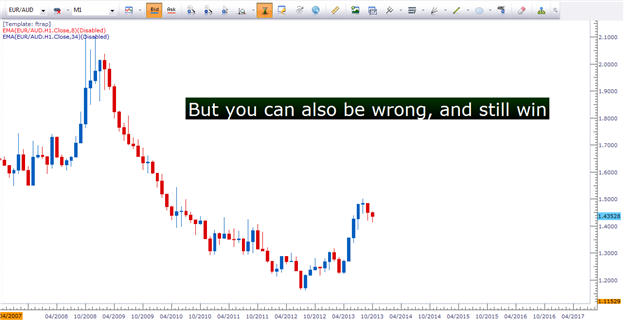
If the Euro weakens, as you expect it to – and if the Yen stays strong, you’re short EURJPY position looks good. But even if the Euro doesn’t weaken, and if it gets strong against US, Canadian, and Australian Dollars – as long as the Yen remains stronger, the position will move lower.
Created with Marketscope/Trading Station II
By focusing on both sides of the currency pair, the trader increases their chances of success. So the next logical question is ‘How?’
The Advanced Way: Separating the Strong from the Weak
We call this ‘strong-weak analysis,’ the process of which includes grading each currency to isolate the strongest individual currencies from the weakest. We can do this with a fairly simple process by focusing on the US Dollar. We can measure the movement of each currency relative to the US Dollar so that we can look at each on an apples-to-apples basis with each other.
So, for instance, if EURUSD is up considerably, but GBPUSD is down – that shows us that Euros have been stronger than dollars; and also that dollars have been stronger than British Pounds. So, from this very simple analysis we can notice that buying EURGBP may be more amenable than buying EURUSD (since GBP was weaker than USD and we want to marry that strong Euro up with the weakest currency).
We can measure the movement of each currency against the US Dollar, and compare each to determine an order of strongest and weakest currencies.
Comparing each currency by focusing on change in USD
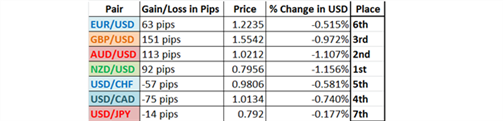
Taken from How to Separate the Strong from the Weak, data from 7-13-2012
From this analysis, we can determine which currency has been strong, and which has been weak. Notice that the NZDUSD is showing a gain of 92 pips. By dividing this into the price of NZDUSD at the time of analysis, we can see that NZDUSD moved up by 1.156% (which also means that US Dollars lost 1.156% against NZD).
We can also see that USDJPY has moved down by 14 pips. But, because USD is the base currency in the quote (listed first), that means that the US Dollar has lost 14 pips against the Japanese Yen. But, after we divide this into the price of USDJPY at the time, we notice that it really isn’t that large of a move; as the dollar has only weakened by .177% against the Japanese Yen.
We can take all of the above information to create the following table, ordering each currency by its percentage movement against the US Dollar:

Taken from How to Separate the Strong from the Weak
Notice that each currency in the previous table strengthened against the US Dollar, so that would mean that USD has actually been the weakest currency during the analyzed period.
This means, we can look to match up what has been a strong New Zealand Dollar with a weak US Dollar. If we want to avoid the US Dollar, that’s ok too… and we can simply choose the next weakest currency on the list as the Japanese Yen.
Or, using the earlier example in which the trader just knew that they wanted to short the Euro; noticing that it’s the 6th strongest currency could reinforce that motivation; but the trader can now instantly see that given recent price action, they would want to investigate selling Euros against New Zealand, and Australian Dollars.
And once again, this doesn’t guarantee that the trade will work out… this simply allows traders to give themselves the best chances of success based on what has happened in the market.
With a focus on probabilities, strong risk management, and a cohesive trade management protocol – traders are ready to Trade the World.
So we just went over a rather in-depth process to find some very important information that can increase our chances of success in the market. And just as I mentioned at the beginning of this article, quite a bit of mathematics and calculation is required.
The Easy Way
So we just went over a rather in-depth process to find some very important information that can increase our chances of success in the market. And just as I mentioned at the beginning of this article, quite a bit of mathematics and calculation is required but that doesn’t mean that you have to do this on your own.
After doing this analysis for a few weeks, you can get the process down to about 15 minutes of your time while doing daily chart analysis.
But we’ve seen so much popularity behind this analysis, and found so many folks that abhor math that we’ve created a tool that will do all of this for you.
This is the StrongWeak App from FXCM, and all of the calculations that we did previously are done automatically by the software.
The FXCM StrongWeak App grades currencies by strength based on 4 TFs
The StrongWeak app will do all of the work that we had done previously in about 15 seconds. As you can see from the picture above, currencies are monitored based on four time frames, and a bar graph will be used to show which currency has been the strongest, and which has been the weakest over the measured period.
And just like in the ‘advanced method,’ we would want to focus our approach on marrying a strong currency with a weaker one, in an effort to get the probabilities on our side as much as we possibly can.
To take matters further, the app will not only measure strength and weakness, but it will use that analysis to show the greatest disparities based on each time frame. These could be looked at as potential ideas for traders to investigate for future trade setups.
The Strong/Weak App automatically finds the largest disparities
So, for the scalper looking to initiate ideas, they could focus on the 15 minute time frame, investigating potential long GBP/CAD positions.
Longer-term traders can look at the Daily grade of a strong GBP, and a weak NZD to look at potential GBPNZD long positions.
If you REALLY want to avoid trading pairings
While trading two-sided pairs is an inevitable part of the FX market, we’ve seen many traders coming from other markets that have had difficulty with the nuance. So, FXCM has created an alternative route for traders that might want to approach the currency market similarly to stocks or futures.
Through the FXCM Mirror Trader platform, traders can trade ‘currency baskets.’
This basically means that traders can simply say ‘I want to short the Euro,’ and voice that opinion by selling the Euro against a diversified basket of currencies.