“After spending many years in Wall Street and after making and losing millions of dollars I want to tell you this: It was never my thinking that made the big money for me. It was always my sitting. Go that? My sitting tight! ... I've known many men who were right at exactly the right time, and began buying or selling stocks when prices were at the very level which should show the greatest profit. And their experience invariably matched mine--that is, they made no real money out of it. Men who can both be right and sit tight are uncommon.”
-Jesse Livermore
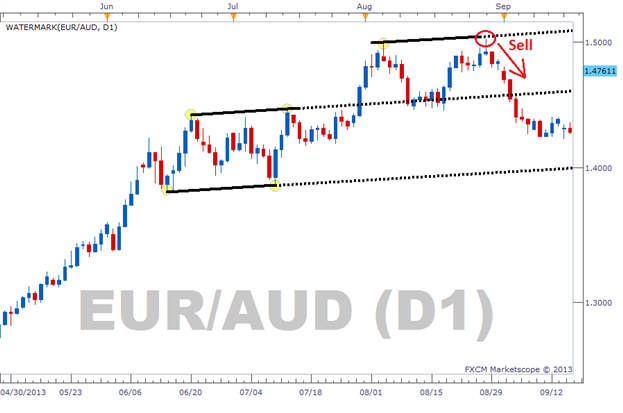
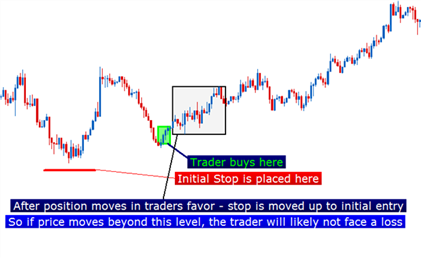
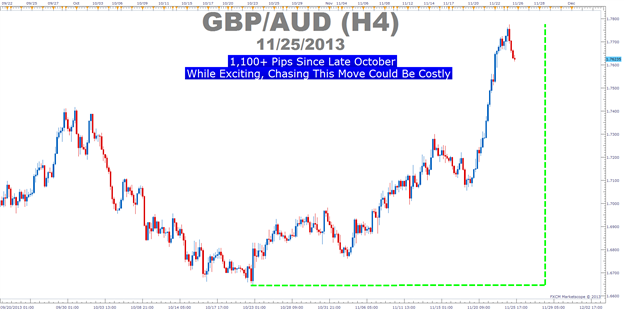
Acting in haste hurts. From a trading perspective, trading in haste or hurry is often known as chasing price. Chasing price often shows itself when you’ve finally talked yourself into a trade only to see it react against your entry shortly after your entry.
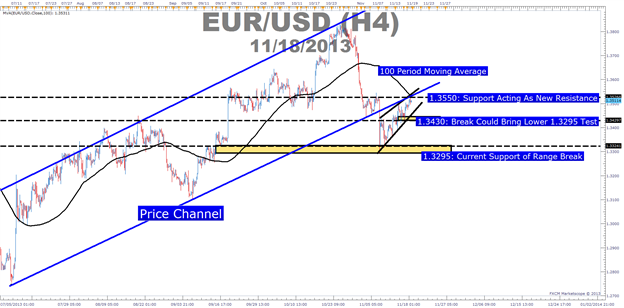
Learn Forex: Big Moves Are Exciting But Approach with Caution
Presented by FXCM’s Marketscope Charts
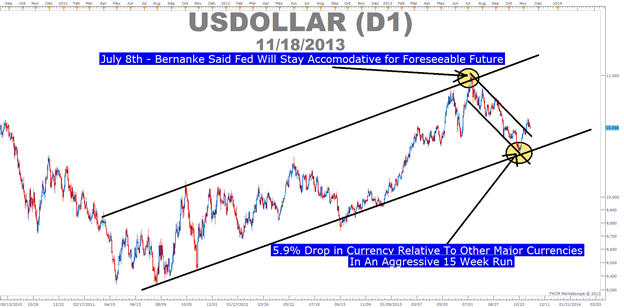
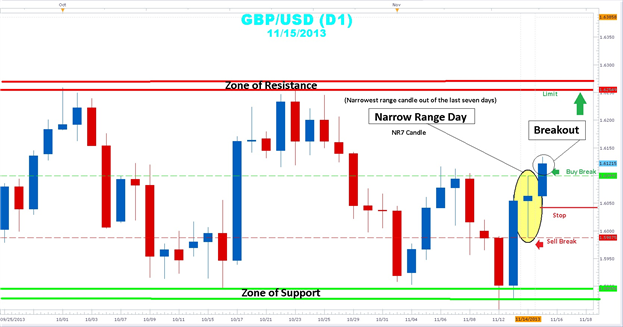
Spotting an Outsize Move
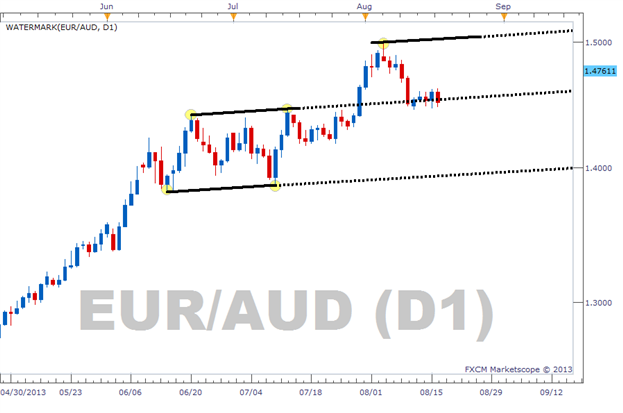
An outsized move can often be seen without any indicators or chart tools. In simple terms, an outsized move like the one seen recently in GBPAUD or GBPJPY will likely take out multiple levels of resistance. When resistance or a prior price ceiling is broken, you have clear indication that the current group of buyers are more confident or holding onto more conviction than they have had in the past when they backed off the move and a correction began.
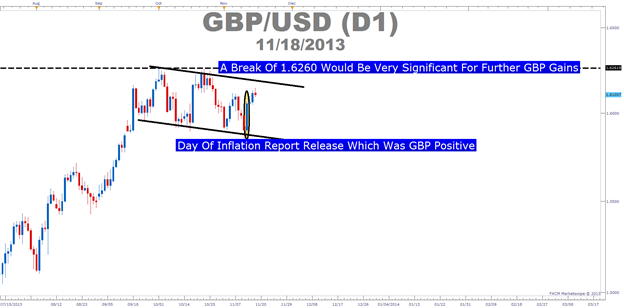
In addition to multiple levels of resistance breaking, you’ll often notice a series of very bullish candles where price consistently closes near the session high over and over again. In an uptrend, this type of moves shows you that buyers are holding this and have little conviction to let off the pressure against the sellers.
Of course, spotting the outsized move is the easy part. The difficulty comes in having the emotional strength to fight off the fear of missing out and waiting for a decent and appropriate level of entry. The ability to wait and identify these points is a key mark of a mature or professional trader.
Meet the Tools – Fibonacci Retracements, Ichimoku, and Pivots
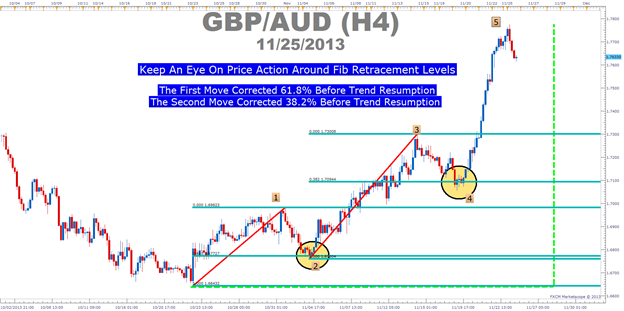
Fibonacci is a sequence of numbers found throughout nature that applies to everything from the atomic structure & DNA molecules to formation of a cyclone or hurricane’s eye that gives the formation its strength. The value often found in the Fibonacci sequence to traders is the ratio between these numbers which show up in and outside of the markets. More often than most believe, a move will correct down to a Fibonacci percentage such at 38.2%, 50% or 61.8% of the prior move.
Learn Forex: GBPAUD recently retraced down to Fib Levels before Bouncing
Presented by FXCM’s Marketscope Charts
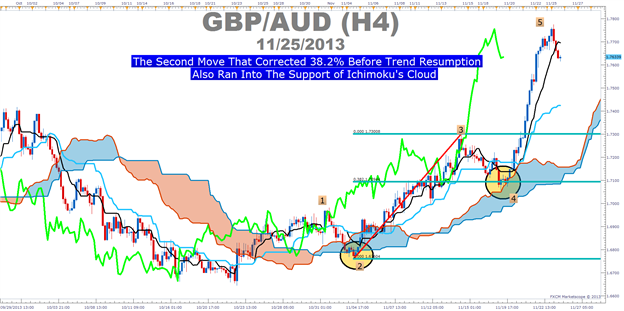
Another key tool that many traders are getting more accustomed to is Ichimoku. Ichimoku is a technical or chart based trend trading system that illustrates support and resistance values in a simplified form and is considered a complement to candlestick trading. Looking to Ichimoku Cloud as a method to identify trend entries is still in use today and can be used in both bullish (rising) and bearish (falling) markets. This dynamic indicator can be used on the time frame of your preference and was voted Best Technical Indicator 9 Consecutive Years in Tokyo’s Nikkei newspaper.
Learn Forex: Ichimoku’s Cloud Shows a Nice Entry on GBPAUD Developing
Presented by FXCM’s Marketscope Charts
As you are likely seeing, it is important to keep an eye out for a confluence of signals showing a correction or retracement may have ended and that you may be approaching an opportunity for reentry. Another tool that can help you see dynamic corrections within an unfolding trend are pivot points. Pivot points are based on recent price action and can help you build a directional bias when price corrects down to the pivot level before resuming the overall trend.
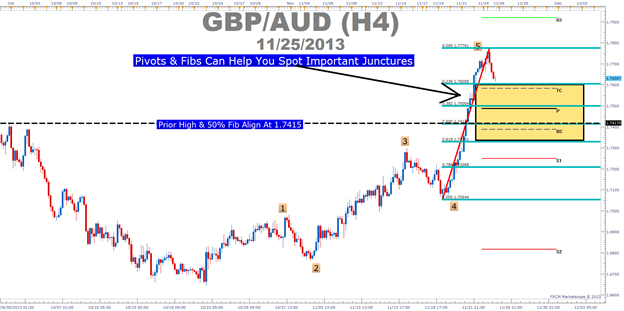
Learn Forex: This Fib Window of 1.7600 -1.7330 Will Be a Focal Point for Reentry
Presented by FXCM’s Marketscope Charts
If you’re unaware of the key levels that are included in Pivot Points, they are the High, Low & Close. Those three critical prices are divided by 3 and that price gives you the pivot for a specific time frame. Therefore, a daily pivot for today would take yesterday’s high, low & close divided by 3 and similarly for weekly pivots.
What’s Next If Focal Prices Are Hit? Price Action & Reaction
On the chart above, we’ve located a few technical indicators that provide potential support on GBPAUD between 1.7330 & 1.7600. Beyond the indicators, you’ll notice that the prior price action high aligns with the current 50% Fibonacci retracement at 1.7415. Also, the August high of 1.7483 is near the current 38.2% retracement, so there could be key moves off those levels. Therefore, this range presents prices where you can look for price action signals like a bullish engulfing pattern that shows the trend could begin its resumption.
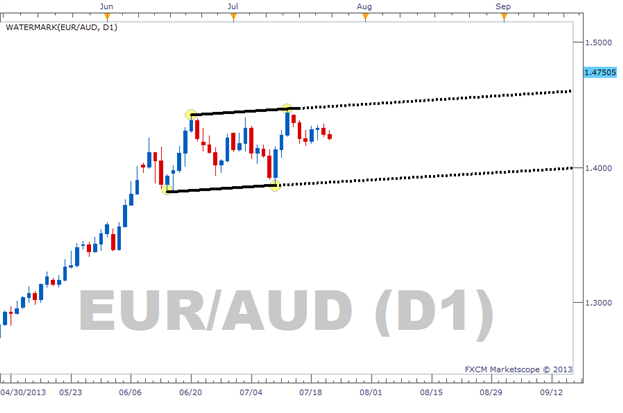
Big Picture of GBPAUD Potential: Bull Flag Opportunity
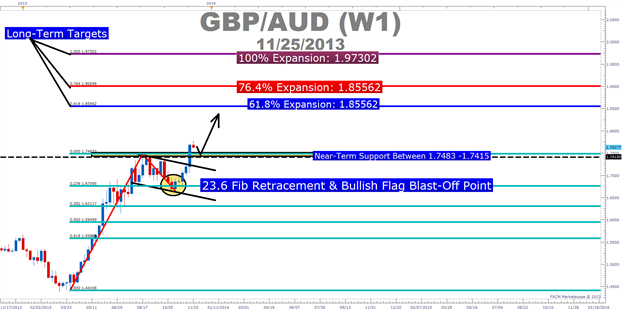
Presented by FXCM’s Marketscope Charts
Source: http://dld.bz/cVpUm