Traders should look to employ a balanced approach when trading in markets.
Fundamental and Technical Analysis can help locate higher-probability setups.
Risk Management and Strong Psychology are necessary for long-term success.
Traders continue to flock to the Forex market in droves. Many of these traders are brand new to markets, and Foreign Exchange is the first venue they’ve looked at; while others are coming from equity or futures markets because the flexibility in FX make it more of a ‘pure trader’s market.’
Regardless of whether you’re just starting to trade or if you’ve been around the market for a while, it often behooves us to have a strategy. Without a strategy, we essentially have to ‘guess’ which positions might work out for us each trading day, in hope that the market cooperates.
The strategy is the process; and it’s the process that will allow you to reach your goals in the arena of trading. What follows are the four most pertinent components of the process traders should look to take into account in order to find long-lasting success in markets.
Fundamental Analysis
Future price movements are often shaped by economic data. When the NFP number gets announced, or when the European Central Bank decides to cut rates; you’ll see this take place very quickly in numerous markets. Traders scramble to price in this ‘new’ information, and if the data was compelling enough, these prices changes can put in longer-term moves (new trends).
This type of thing happens in all markets; but what makes Foreign-exchange different is the realm of impact each of these data prints can bring.
As an example, The European Central Bank cut rates 25 basis points on November the 7th of this year. This would normally be bearish for an economy; with lower rates of return, there is less incentive for foreign investors to deposit capital. And surely, as this news came in the market the Euro was punished lower by over 200 pips.
Fundamental data can bring MASSIVE volatility to markets; but will it last?
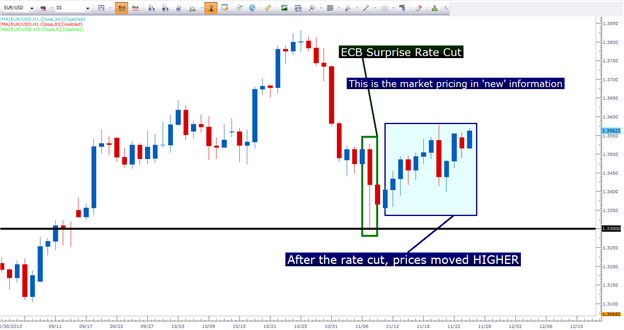
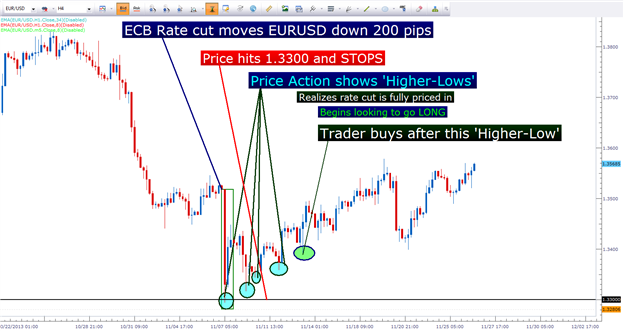
Created with Marketscope/Trading Station II
After the ECB shocked markets with the November rate cut, the Euro continued to move lower until it hit a price of 1.3300 (marked with the black line in the above graphic); at which point, prices began to reverse and move higher. As of this writing (28 November 2013), EUR/USD is over 250 pips higher than this 1.3300 level of resistance.
So, the ECB cut rates and prices moved over 200 pips lower, only to reverse at 1.3300. Price on EUR/USD then moved higher by 250 pips (and higher than the pre-ECB rate cut level).
What does this tell us about fundamental analysis in the FX market?
Fundamental data (and their accompanying announcements) can spark price movements in the Forex market. But these fundamental announcements are unpredictable… and even if we could predict these events, there would be no way to know exactly how the market will price them in.
This is where the trader needs to incorporate additional tools into their approach; and we’ll talk about some of those below.
Technical Analysis
Fundamentals alone aren’t enough for the FX trader.
For a few different reasons, Technical Analysis has a much more prominent role in FX as opposed to other markets. Surely, Technical Analysis is used by stock and futures traders; but in FX we’re dealing with entirely different subject matter.
As an example – a 10% movement in a day for a single stock can be considered a ‘great day.’ Movements of 5% or more are extremely common, especially when markets are pricing in new information (like earnings). Movements of 20% or more are less common, but they happen with regularity.
If a currency were to move 20% in a day, much bigger issues are at stake. In the above example, we looked at a 200+ pip movement in the EURUSD, which I described as ‘massive.’ And, in relative scope – this was a massive move.
But 200 pips in the EURUSD is really only about a 1.5% move
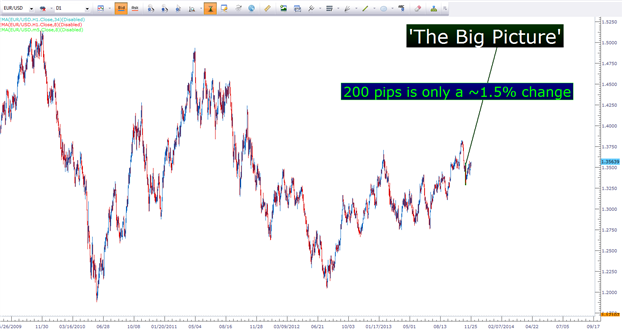
Created with Marketscope/Trading Station II
With currencies, much more is at stake than just one single company, in one single economy. We’re talking about the foundation by which our entire civilization is founded upon. Daily volatility of 5% or more in a developed nation’s currency could wreak havoc on that economy, and any economy that wanted to trade with them.
So, in general – price movements are smaller in FX…. But we also have more leverage to work with. This isn’t ‘just’ a good thing, because leverage can amplify gains AND losses; but this speaks to the flexibility that I mentioned at the beginning of this article.
As a trader, when I want to turn up the leverage on a position, it’s my right to do so in the FX market. In stocks, that option isn’t even available as maximum leverage is capped at four times account equity.
But, because these price movements are, in general, smaller than what we might see in other markets; traders often place a higher importance on technical analysis in seeking out trades or positions.
Technical Analysis is the art of using the chart, and past prices in an effort to find trade setups; so, technical analysis is really just a way of examining the past; and there are a lot of different ways of doing so.
Some traders prefer to use indicators like Moving Averages, or RSI; and these can be good if used correctly. But what often happens is that a trader finds that an indicator can help, so they automatically think that two must be better; and if two is better, why not three?
A wise trader once told me that any indicator is really just a fancy moving average; and this is truth. Indicators are based on past prices; they just use their own mathematical formula to derive the indicator value. Because of this, Price Action is often considered to be one of the more ‘clean’ manners of examining past prices. Price Action strips out the mathematical formula and focuses solely on price.
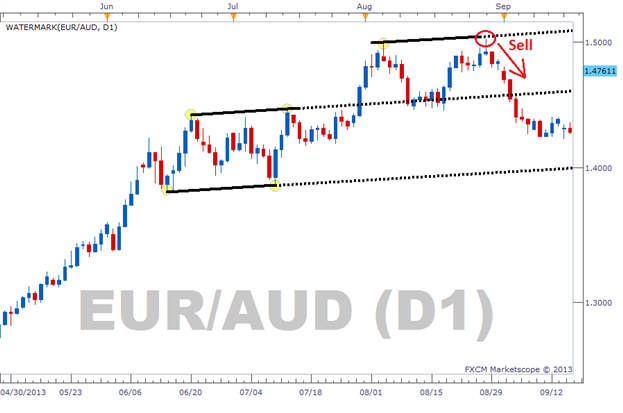
In the previous example of the EURUSD reaction after the ECB rate cut, do you remember where price had made its miraculous turn-around? The turnaround in EURUSD happened right after 1.3300 came into play; a perfect example of price action at work. The price of 1.3300 is considered a ‘Psychological Whole Number,’ that can often exhibit elements of support and/or resistance; similar to EURUSD at 1.3000, although 1.3300 wouldn’t be considered ‘as round’ as 1.3000.
But Price Action can do a lot more than just show us psychological levels on charts. We could’ve used price action to trade that EURUSD setup very proficiently.
Created with Marketscope/Trading Station II
Price action can be used to find and grade trends, find support and resistances levels, and also trigger into positions.
So, to recap: Fundamentals help shape future price movements; and technical analysis can help explain past price movements. Between these two analytical systems, we can begin to focus on the highest-probability strategies and setups.
But this will not remove risk; and until a trader learns to manage their risk, the probability of profitability (long-term) will remain miniscule – and because of that, Risk Management isn’t just a preference, it’s a necessity.
Risk Management
An inevitable part of trading is losing. Because you cannot predict the future, you will, at least on occasion, be wrong. And if you aren’t managing your risk, one losing position can wipe away the gains from many winners. As long as this risk impacts the trader, the trader will struggle to find consistent profitability.
So, before a trader can ever find consistent profitability, they first have to learn how to lose properly.
Risk management matters. We even wanted to prove this to ourselves, and this is where the Traits of Successful Traders research comes from. David Rodriguez spent a considerable amount of time analyzing over 12 million trades placed by real traders on live platforms through FXCM. These were positions triggered with the goal of making a profit, and the results speak very loudly.
The Number One Mistake that Forex Traders Make is faulty risk-reward. In some currency pairs, the results were just shocking. In GBPJPY, for instance, traders won in 66% of their trades. That’s two out of every three trades! But this winning percentage doesn’t matter much when these traders were losing, on average $2.34 for every $1 made (122 pip average loss, 52 pip average win).
Winning Percentage isn’t the only factor of profitability…
Image taken from The Number One Mistake Forex Traders Make
Traders can look to prevent the number one mistake by simply using a stop and limit order to enforce a minimum 1-to-1 risk-to-reward ratio.
So, if you set a stop of 50 pips look for at least 50 pips on the limit or profit target of the trade. Set your risk at the outset of a trade based on fundamental and technical analysis. If the position moves against you, so be it; but do not throw good money after bad money by widening your stop in the ‘hope’ that the position comes back.
One of the most difficult things about trading is dealing with losses. It’s almost inhuman to be comfortable with losing, no matter how inevitable it may be. This is why trading psychology is so important…
Trading Psychology
One of the most difficult aspects of trading to master isn’t fundamental or technical analysis; it’s our own psychology.
As human beings, we generally look at success based on how often we are right. But, just like we saw above, those traders in GBPJPY that are winning 66% of the time; they might feel successful but they’re STILL losing money.
If we reverse the above ratios; where traders are winning 33% of the time (1 out of 3), but winning 152 pips on each win, and losing 52 pips on each loss – let’s take a look at the average results:
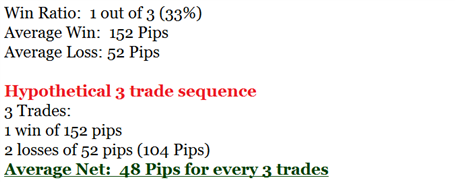
In the above graphic, you can see how a 33% winning ratio can amount to a profitable strategy.
The trader achieving these statistics, winning 33% of their trades with an average win of 152 pips and an average loss of 52 pips is averaging a 48 pip net profit for every three trades that they’re placing. This trader is making money.
But do they feel like they’re making money? They’re failing two out of every three trades. Most human beings, despite being profitable, would feel like they’re losers, or inadequate in some way because they can only win one out of every three trades that they’re placing.
This is where the importance of a Positive Outlook comes into play; enabling the trader to look at the bigger picture, losing properly when they are wrong, and focusing on managing winning trades while the losers manage themselves.