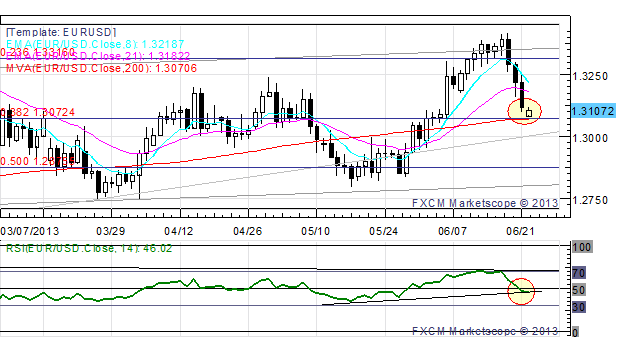
- EUR/USD came under further pressure on Wednesday and broke below the 2x1 Gann angle line of the year-to-date low in the 1.3045 area
- Our trend bias remains lower in the exchange rate with focus now on the 4th square root progression of the month-to-date high near 1.2950
- The level can often times spark a counter-trend reaction and a close below 1.2950 is required to maintain the immediate downside tack
- Longer-term cycle studies remain negative on the Euro, but shorter-term counts suggest trading could become choppy over the next few days as a variety of very minor turn windows materialize
- The 3rd square root progression of this month’s high near 1.3065 is immediate resistance, but only clear strength over 1.3185 turns us positive on the Euro
Strategy: Short positions favored while below 1.3185
Exchange Rate
|
Support 2
|
Support 1
|
Spot
|
Resistance 1
|
Resistance 2
|
EUR/USD
|
1.2900
|
*1.2950
|
1.3035
|
1.3065
|
*1.3185
|
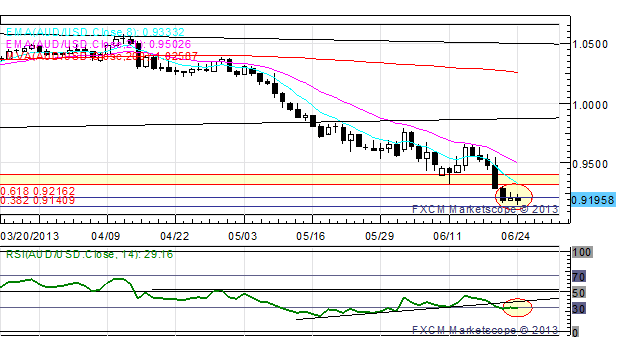
AUD/USD:

- AUD/USD continues to struggle higher off the 13th square root progression of the year-to-date high in the .9175 area
- Our trend bias is still lower in the Aussie with clear strength above .9425 needed to signal some sort of trend shift
- Long-term cycle studies warn of a turn this week, but shorter-term counts point to a minor turn window at the end of the week
- Back under .9175 exposes key long-term support at .9135
- A close below there is needed to signal the start of another more important decline
Strategy: Like being flat around these longer-term support levels. May look to go long over .9425.
Exchange Rate
|
Support 2
|
Support 1
|
Spot
|
Resistance 1
|
Resistance 2
|
AUD/USD
|
*0.9135
|
0.9175
|
0.9310
|
0.9335
|
*0.9425
|
USD/CAD:

- USD/CAD has come under steady pressure over the past couple of days after finding stiff resistance near the 88.6% retracement of the 2011 to 2012 decline in the 1.0540 area
- Our trend bias is still higher, but a close above 1.0540 is now needed to signal a resumption of the broader uptrend
- Near-term focused time cycles point to further weakness over the next few days
- Immediate support is seen at the 4th square root progression of May low in the 1.0410 area
- However, only aggressive weakness below a retracement convergence near 1.0340 would turn us negative on Funds
Strategy: Like buying Funds against 1.0340 over the next few days.
Exchange Rate
|
Support 2
|
Support 1
|
Spot
|
Resistance 1
|
Resistance 2
|
USD/CAD
|
*1.0340
|
1.0410
|
1.0440
|
1.0500
|
*1.0540
|
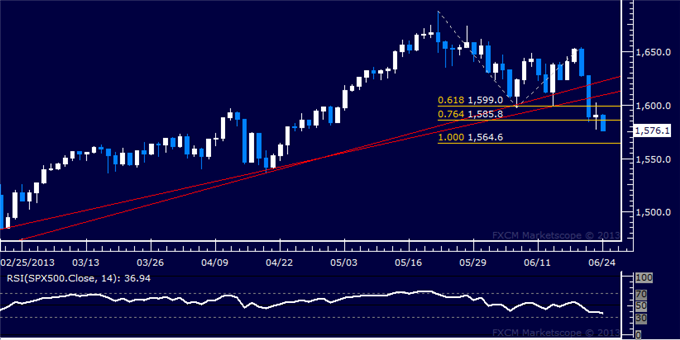
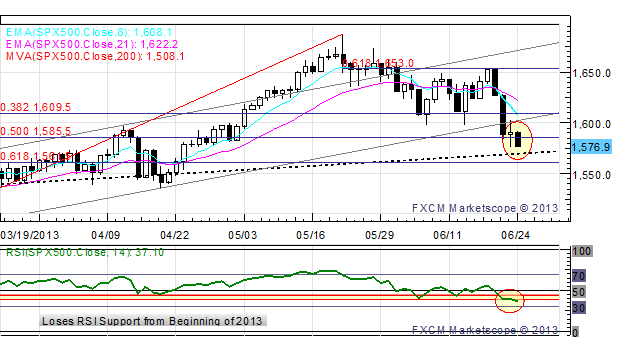
Focus Chart of the Day: S&P 500

The reversal in the S&P 500 at the start of the week was a good example of how a cycle turn window is ideally supposed to work. The short-term trend was down leading into the June 20-25 window following the break of the early June lows. During this time period the index successfully tested a key level of symmetry at 1565 as this marked a convergence of the 3rd square root progression of the 1687 all-time high and a measured move of the early June decline. Just how important this upside resumption is will now depend on how the index reacts at key Gann levels near 1605 and 1637. Traction over the latter is required to set up a re-test of the May high. In a similar vain to Gold, any unexpected aggressive weakness that violates Monday’s price/time convergence would be a very negative cyclical development and opens the way for a much more aggressive equity decline in the weeks ahead.
Source: http://dld.bz/cFGjr