
First off, a trendline is a line connecting two or more lows or two or more highs, with the lines projected out into the future. The creation of a price channel consists of placing two trendlines that are parallel to each other, above and below the price action on the chart. Traders then project these parallel lines out into the future to predict price moves by playing the bounces off these lines.
I've developed a nuanced way of drawing trendlines that can at times predict trendlines before they even happen, and that is what this article aims to teach. This technique can be applied on short, medium, and long term charts and on any currency pair.
Recognizing a Price Channel Break
We first want to identify a clear a price channel that exists somewhere in the last 200 bars. The width of the channel doesn't matter, but we do want to see some sort of an angle either bullish or bearish (slanting up or slanting down). We also want to see the price bounce successfully off each of the top and bottom lines in the channel at least twice to create a legitimate price channel. I've identified a price channel below on the EUR/AUD daily chart.
Learn Forex: Drawing a Price Channel
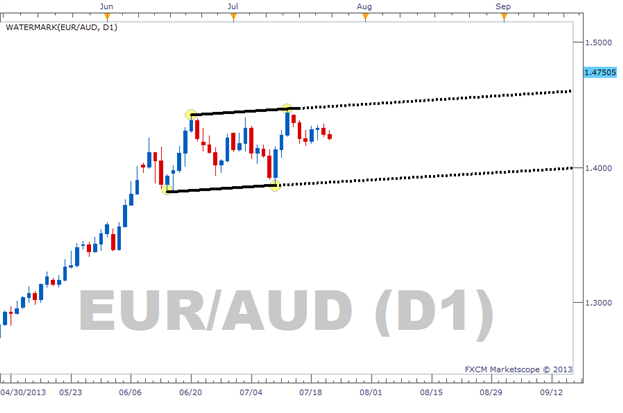
(created from FXCM Marketscope 2.0)
Once drawn, we now wait for the currency pair to break out of the price channel in either direction. There are several ways you can trade a trendline break, but this is not what we are looking to trade when using this technique. We want to wait until we see a new swing high above the price channel, or a new swing low below the price channel. In other words, we want a new high where the price then retreats for a few bars or a new low where the price then rallies for a few bars. Once seen, this is where things begin to get interesting.
Predicting the Next Trendline
Once we have identified a new swing high/low, we want to create a new trendline that is parallel to the previous price channel lines that begins at the new high/low. So this will be a 3rd line on your chart that intersects the most recent high/low. We can draw a parallel line from an original line by holding down the “Ctrl” key while clicking and dragging an existing line (on Marketscope 2.0 charting package).
Learn Forex: Predicting the Next Trendline
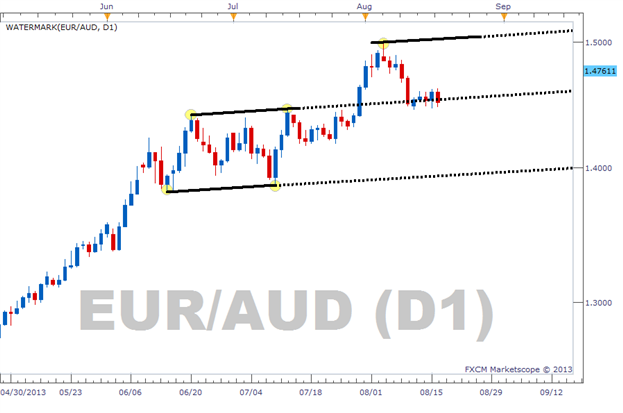
(created from FXCM Marketscope 2.0)
The chart above shows the 3rd line in place at the new swing high. This now gives us a level where price could face resistance. Even though this trendline has not been confirmed by a 2nd bounce, we will often times see the price bounce off this line the next time the price gets near it.
Placing the Trade
In this example, we will look to sell just below this trendline if price rallies to that level again. We will place a stop a few pips above the trendline, and our limit will be placed at least twice as far so that we have a 1:2 risk/reward ratio.
Learn Forex: Trading the New Trendline
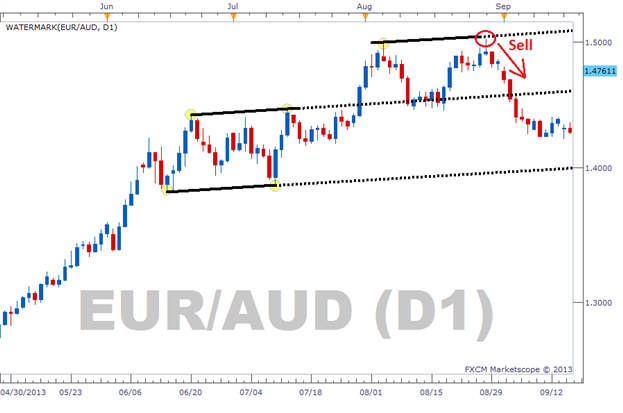
(created from FXCM Marketscope 2.0)
We received a great entry on our trade just above the 1.50 level, and could have kept this trade open for several hundred pips had we let it run further to the down side. But, I am comfortable with using a simple 1:2 risk/reward ratio which would have easily been hit.
Source: http://dld.bz/cUQrD
No comments:
Post a Comment