Monday, 3 June 2013

Forex Trading — Understanding Commissions, Spreads and Trading Costs


The forex market is quickly becoming one of the most popular markets for trading.

Not only are the experienced traders looking to this market to maximize their trading returns, but many new, individual investors are now able to trade the Forex market — just as they do stocks and futures.

More and more individuals are seeing Forex not only as a new way to diversify their portfolio, but are also finding that it is becoming the most profitable component of their investments.

And that's because of the many advantages Forex offers over other markets like stocks or commodities. Here's what you will typically see advertized about Forex:

— Unparallelled liquidity. It is the largest financial market in the world by far. Almost $2 trillion being traded daily!

— Excellent leverage potential. Individual investors have access to leverage of 100:1 and even 200:1

— No Commissions (more on this later on)

— Low trading costs.

And yes, the Forex market really does offer all these advantages.

But the last two points above talk about costs, and that's what we'd like to focus on in this article.

Like any trading, there are costs involved, and, while these may be much lower than they used to be, it is important to understand what those are.

Let's start by looking at stock trading, something that most of us investors are pretty familiar with.

When trading stocks, most investors will have a trading account with a broker somewhere and will have investment funds deposited in that account.

The broker will then execute the trades on behalf of the account holder, and of course, in return for providing that service, the broker will want to be compensated.

With stocks, typically, the broker will earn a commission for executing the trade. They will charge either a fixed dollar amount per trade, or a dollar amount per share, or (most commonly) a scaled commission based on how big your trade is.

And, they will charge it on both sides of the transaction. That is to say, when you buy the stock you get charged commission, AND then when you sell that same stock you get charged another commission.

With Forex trading, the brokers constantly advertise "no commission". And, of course that's true — except for a few brokers, who do charge a commission similar to stocks.

But also, of course, the brokers aren't performing their trading services for free. They too make money.

The way they do that is by charging the investor a "spread". Simply put, the spread is the difference between the bid price and the ask price for the currency being traded.

The broker will add this spread onto the price of the trade and keep it as their fee for trading.

So, while it isn't a commission per se, it behaves in practically the same way. It is just a little more hidden.

The good news though is that typically this spread is only charged on one side of the transaction. In other words, you don't pay the spread when you buy AND then again when you sell. It is usually only charged on the "buy" side of the trades.

So the spread really is your primary cost of trading the Forex and you should pay attention to the details of what the different brokers offer.

The spreads offered can vary pretty dramatically from broker to broker. And while it may not seem like much of a difference to be trading with a 5 pip spread vs a 4 pip spread, it actually can add up very quickly when you multiply it out by how many trades you make and how much money you're trading. Think about it, 4 pips vs 5 pips is a difference of 25% on your trading costs.

The other thing to recognize is that spreads can vary based on what currencies you're trading and what type of account you open.

Most brokers will give you different spreads for different currencies. The most popular currency pairs like the EURUSD or GBPUSD will typically have the lowest spreads, while currencies that have less demand will likely be traded with higher spreads.

Be sure to think about what currencies you are most likely to be trading and find out what your spreads will be for those currencies.

Also, some brokers will offer different spreads for different types of accounts. A mini account, for example may be subject to higher spreads than a full contract account.

And finally, because the spreads really are the difference between bid prices and ask prices as determined by the free market, it is important to recognize that they are not "guaranteed". Most brokers will tell you that there may be times during periods of low demand, or very active trading when the spreads widen and you will be charged that wider spread.

These do tend to be rarer situations because the Forex market really is so large and demand and supply are generally quite predictable, but they do occur, especially with some of the lesser traded currencies. So it's important to be aware of that.

In summary then, when trading Forex, understand that the "spread" is truly your most important consideration for trading costs.

Spreads can vary significantly between brokers, account types and currencies traded. And small differences in the spread can really add up to thousands of dollars in trading costs over even just a few months.

So be sure to understand what currencies you are going to be trading, how frequently, and in what type of account and use those factors to help decide which broker can offer you the best trading costs.

Source: http://www.earnforex.com/articles/forex-trading-understanding-commissions-spreads-and-trading-costs


European Reports Better than US Data, EUR/USD Jumps

EUR/USD climbed today as macroeconomic reports were worse than expected, sparking talks that the Federal Reserve may maintain its stimulus program for a prolonged time. Meanwhile, European data was better than expected. The euro gained on the dollar as a result.
ISM manufacturing PMI fell from 50.7% in April to 49.0% (a reading below 50.0% indicated contraction of the sector). It was the first decline since November 2012. Analysts have thought that the index would stay unchanged. (Event A on the chart.)
Construction spending grew 0.4% in April from March. It was rather small growth compared to the expected 1.1%. The March reading was revised positively from -1.7% to 0.8%. (Event A on the chart.)

EUR/USD for 2013-06-03

Source: http://www.earnforex.com/blog/european-reports-better-than-us-data-eurusd-jumps/

Sunday, 2 June 2013

Long US Dollar AND Stocks Are Both Crowded…and Both at Risk!

June is historically the worst month for the stock market. Judging by the last few hours of trading, June apparently came early. A bigger stock market setback probably occurs coincident with a decline in the US Dollar. Why? Long USD and long stocks are both crowded trades. In times of panic, crowded trades get destroyed.

USDOLLAR
Daily
Long_US_Dollar_AND_Stocks_are_both_Crowded_and_Both_at_Risk_body_usdollar.png, Long US Dollar AND Stocks are both Crowded…and Both at Risk
Chart Prepared by Jamie Saettele, CMT using Marketscope 2.0
Are you new to FX or curious about your trading IQ?

FOREXAnalysis: USDOLLAR technicals have pointed us in the right direction of late. Entering May, we were looking for a broad based USD rally to complete 5 waves up from the September low. The reversal off of the Elliott channel (2 reversals actually…5/23 and 5/29) now warns of lower prices in the weeks ahead. How low? I don’t know but I do know that estimated support is 10655 and 10597. Of interest as well is the top side of the former resistance line that extends off of the 2011 and 2012 highs, and of course channel support that defines the advance from the September low.

FOREX Trading Strategy: Looking for a low between 10597 and 10655…the lower and quicker we get there the better. A fast ‘panicky’ decline, preferably closer to 10597, might be enough to ‘reset’ the market for the next leg higher.

USDJPY
Daily
Long_US_Dollar_AND_Stocks_are_both_Crowded_and_Both_at_Risk_body_usdjpy.png, Long US Dollar AND Stocks are both Crowded…and Both at Risk
Chart Prepared by Jamie Saettele, CMT using Marketscope 2.0
Are you new to FX or curious about your trading IQ?

FOREXAnalysis: The USDJPY rally from 90.84 is an ending diagonal (wedge). Such patterns are usually resolved violently and often fully retraced. Last week’s outside reversal week on a slightly less than record week of volume (CME volume was slightly less than the week that ended 8/17/07) is consistent with an important top. After a pop into 102.50, the USDJPY closed the week lower which qualifies as follow through on the reversal. It’s a good sign for bears that price has separated a bit from the 5/23 close (large range and volume day) of 101.97. Large range and volume days are valuable as pivots (below is bearish and above is bullish). A trendline that extends off of the November 2012 and April 2013 lows is at about 98.40 on Monday and increases about 10 pips per day. The 5/8 low at 98.57 reinforces the area as one of interest. This could be the first support (minor) in a much needed decline. 96.70-97.40 is probably stronger if reached.

FOREX Trading Strategy: Bearish below 102.00 towards 98.50 and 97.00.

AUDUSD
Daily
Long_US_Dollar_AND_Stocks_are_both_Crowded_and_Both_at_Risk_body_audusd.png, Long US Dollar AND Stocks are both Crowded…and Both at Risk
Chart Prepared by Jamie Saettele, CMT using Marketscope 2.0
Are you new to FX or curious about your trading IQ?

FOREXAnalysis: The AUDUSD traded to its lowest level since 10/4/2011 on Wednesday before reversing sharply. A long legged key reversal at an important level (the long held AUDUSD target of .9605 has been reached but has never been closed below) after a brutal decline is consistent with at least a near term low. From an Elliott perspective, a rally would probably compose a 4th wave and could carry back to .9841 before the next top forms. The circled area on the chart highlights the December 2010 low and day of the October 2011 low.

FOREXTrading Strategy: Above .9700 is needed in order to trade on the long side into .9840. I’m looking for resistance into .9840/80. The underside of the line that extends off of the 2011 and 2012 lows is at about .9880 next week.

GBPUSD
Daily
Long_US_Dollar_AND_Stocks_are_both_Crowded_and_Both_at_Risk_body_gbpusd.png, Long US Dollar AND Stocks are both Crowded…and Both at Risk
Chart Prepared by Jamie Saettele, CMT using Marketscope 2.0
Are you new to FX or curious about your trading IQ?

FOREXAnalysis: 5 waves are evident from the May GBPUSD high. The implications are for a correction of that decline before the next bear leg. The most likely stopping point for the advance is 1.5322/77 (former 4th wave and 61.8% retracement). Near term support is 1.5127.

FOREXTrading Strategy: Evidence (outside day reversal at an important level and a mature wave pattern) suggests we look higher but probably into a top that will be sold in to. Support is estimated at 1.5127 and resistance at 1.5322/77. Breakout systems will be of use after this next advance.
 

Price & Time: Critical Couple of Days Coming Up For JPY, AUD & CAD


This publication attempts to further explore the concept that mass movements of human psychology, as represented by the financial markets, are subject to the mathematical laws of nature and through the use of various geometric, arithmetic, statistical and cyclical techniques a better understanding of markets and their corresponding movements can be achieved.Foreign Exchange Price & Time at a Glance:
USD/JPY:
PT_AUDCADJPY_body_Picture_4.png, Price & Time: Critical Couple of Days Coming Up For JPY, AUD & CAD
Charts Created using Marketscope – Prepared by Kristian Kerr

-USD/JPY has continued to slide over the past few days and touched its lowest level in more than three weeks on Friday
-While below the 2nd square root progression of the year-to-date high at 101.70 our bias is lower in the exchange rate
-The 50% retracement of the May range in the 100.35 area is a key near-term pivot with weakness below needed to expose critical Gann support at 99.60/90
-Next few days are extremely important for the pair from a time cycle perspective as a Pi cycle relationship with the September low should influence
-Traction over 101.70 would signal an upside resumption and shift our bias higher

Strategy: Watching to see how the rate reacts in the cyclical turn window over the next few days before positioning aggressively. Chances of a low are increasing.


AUD/USD:
PT_AUDCADJPY_body_Picture_3.png, Price & Time: Critical Couple of Days Coming Up For JPY, AUD & CAD
Charts Created using Marketscope – Prepared by Kristian Kerr

-AUD/USD continues to meander along the 1x2 Gann angle line of the year-to-date closing high
-While below a key confluence of Gann and Fibonacci levels in the .9790 to .9810 area our bias has to remain lower
-However, with the rate entering a potentially important cyclical turn window related to the January and April peaks early next week the Aussie is more vulnerable to a reversal
-The 50% retracement of the 2010 to 2011 advance and the 10th square root progression of the year-to-date high in the .9570/40 area is an important support with a close below required to maintain the downside tack
-A clear break of .9810 is needed to signal the start of a more significant upside correction

Strategy: Like covering remaining short postions here and re-positioning in a few days after the turn window.

GOLD:
PT_AUDCADJPY_body_Picture_2.png, Price & Time: Critical Couple of Days Coming Up For JPY, AUD & CAD
Charts Created using Marketscope – Prepared by Kristian Kerr

-XAU/USD finally managed to close above the 1395 2nd square root progression of the year-to-date low on Thursday
-Our bias is now higher in the metal with focus on the 3rd square root progression at 1433
-Traction over this level is required to setup a bigger push towards 1460 and above
-The medium-term cycles turned positive a couple of weeks ago, but a bigger picture cyclical inflection point is seen in the second half of June
-The 1395 level is now immediate support, but only weakness below the 1st square root progression of the year-to-date low at 1358 turns us negative on the metal

Strategy: Long positions favored here in Gold against 1358.

Focus Chart of the Day: CAD/JPY

PT_AUDCADJPY_body_Picture_1.png, Price & Time: Critical Couple of Days Coming Up For JPY, AUD & CAD

The Yen has thrown us a curve ball (or googlie depending on what part of the world you live) as we enter this important cyclical turn window over the next few days. What initially looked like a clear potential top in USD/JPY could now just as easily be a low with the persistent weakness being exhibited in the pair over the past week. In fact, the price action of the past few days is eerily reminiscent of the action seen just ahead of the last cyclical turn widow of importance in early May. With time cycles also suggesting heightened potential for turns in the AUD/USD and USD/CAD it seems natural to look at the crossrates of AUD/JPY and CAD/JPY for further clues. While only CAD/JPY is shown above, both have been in pretty clear downtrends over the past few weeks and are prone to turn during this window. In CAD/JPY key support zones look to be 96.05/25 and 94.65/95. A test and hold of these levels over the next few days will set up a compelling long side trading opportunity from a price & time perspective. More to come as/if it unfolds.


EUR/AUD — A Really Long Ascending Channel on Daily Chart

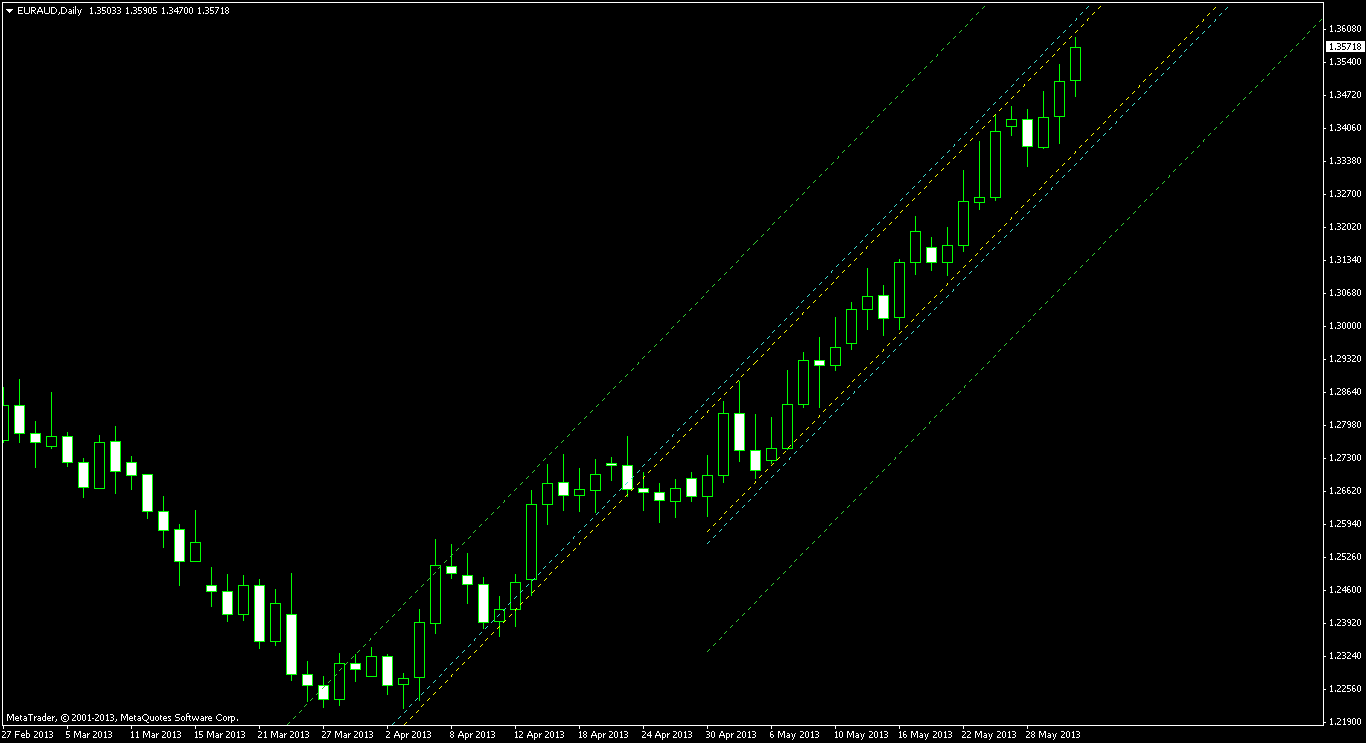
Today’s EUR/AUD pattern can be traced back to April 24, and the pair’s growth totals nearly 1,000 pips in that period. There have been numerous touches of both borders to confirm the validity of the channel. The biggest problem with this chart formation is that it does not follow a descending trend, whereas classical ascending channel is just a temporary correction for a bearish rally. Nevertheless, I will trade this pattern and will try to earn what little pips it has to offer.

As always, the pattern itself is marked using the yellow lines. The cyan lines represent the entry levels positioned at 10% of the channel’s height from the borders. The green lines represent the target levels positioned at 100% of the channel’s height from the borders. I will consider only bearish breakouts and will use the high of the breakout candle as my stop-loss level. In case the breakout candle is traded mostly outside the yellow borders, the candle before the breakout one will be used for the stop-loss.

EUR/AUD Ascending Channel on Daily Chart as of 2013-06-02

Source: http://www.earnforex.com/blog/euraud-a-really-long-ascending-channel-on-daily-chart/

EUR/JPY — A Week-Long Rectangle on H4 Chart

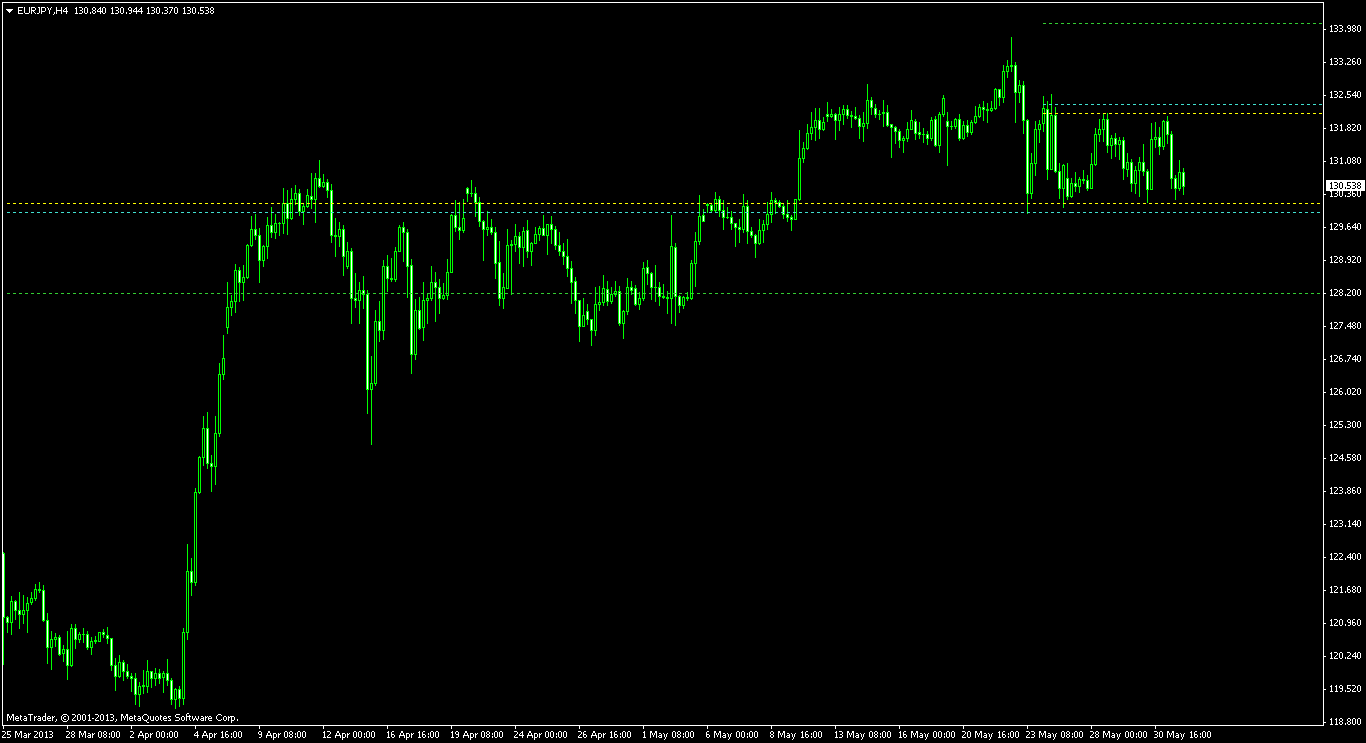
While the position opened using the bullish pennant pattern breakout on EUR/JPY is still running, the currency pair formed a new figure on a shorter timeframe. The rectangle, which spans from May 24 and is about 200 pips high, is a two-way breakout opportunity. The pattern is clearly visible on H4 chart.
The image below shows the rectangle with two horizontal yellow lines. At the distance of 10% of its height, the cyan lines are positioned for potential entry. Green lines at 100% height from the yellow lines are the potential take-profit levels. Both entry and TP lines have been added using the ChannelPattern script. I will use the low/high of the breakout bar for my buy/sell stop-loss on this pattern. I will also close my EUR/JPY bullish pennant trade if this rectangle breaks to the downside.


EUR/JPY Rectangle on H4 Chart as of 2013-06-02

Source: http://www.earnforex.com/blog/eurjpy-a-week-long-rectangle-on-h4-chart/

Forex Technical Analysis For Week 03/06/2013 – 07/06/2013


Camarilla Pivot Points
Pair4th Sup3rd Sup2nd Sup1st Sup1st Res2nd Res3rd Res4th Res
EUR/USD1.28721.29331.29541.29741.30151.30351.30561.3117
GBP/USD1.50641.51281.51491.51701.52131.52341.52551.5319
USD/JPY99.1799.81100.02100.23100.65100.86101.07101.70
EUR/JPY129.47130.00130.18130.36130.71130.89131.07131.61
GBP/JPY151.30151.94152.16152.37152.80153.01153.23153.87


Tom DeMark’s Pivot Points
PairEUR/USDGBP/USDUSD/JPYEUR/JPYGBP/JPY
Resistance1.31391.5331101.48131.33153.57
Support1.29161.509999.18129.39151.23


Fibonacci Retracement Levels
PairsEUR/USDGBP/USDUSD/JPYEUR/JPYGBP/JPY
100.0%1.30601.5238102.51132.13154.56
61.8%1.29751.5150101.63131.39153.66
50.0%1.29491.5123101.36131.16153.39
38.2%1.29231.5095101.09130.93153.11
23.6%1.28901.5061100.76130.64152.77
0.0%1.28381.5007100.21130.18152.21