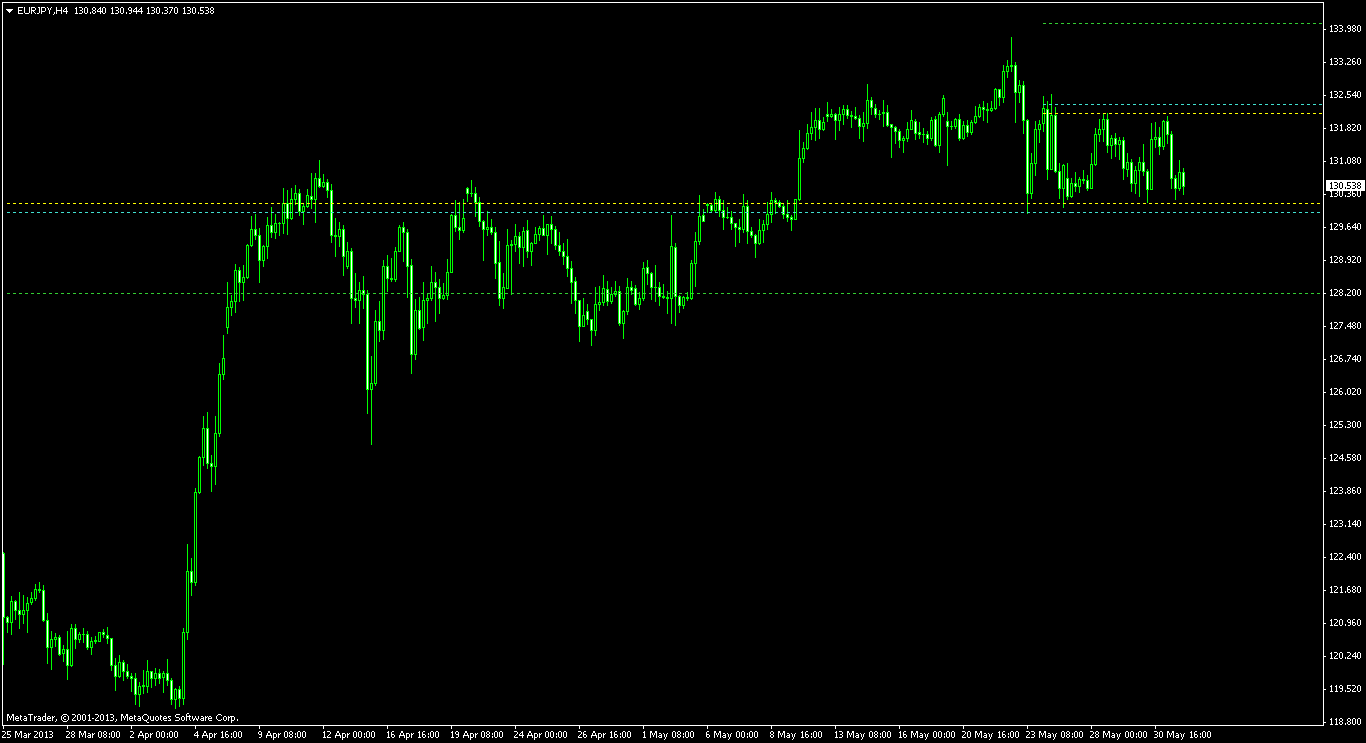
While the position opened using the bullish pennant pattern breakout on EUR/JPY is still running, the currency pair formed a new figure on a shorter timeframe. The rectangle, which spans from May 24 and is about 200 pips high, is a
two-way breakout opportunity. The pattern is clearly visible on H4 chart.
The image below shows the rectangle with two horizontal yellow lines. At the distance of 10% of its height, the cyan lines are positioned for potential entry. Green lines at 100% height from the yellow lines are the potential
take-profit levels. Both entry and TP lines have been added using the ChannelPattern script. I will use the low/high of the breakout bar for my buy/sell
stop-loss on this pattern. I will also close my EUR/JPY bullish pennant trade if this rectangle breaks to the downside.

Source:
http://www.earnforex.com/blog/eurjpy-a-week-long-rectangle-on-h4-chart/

No comments:
Post a Comment