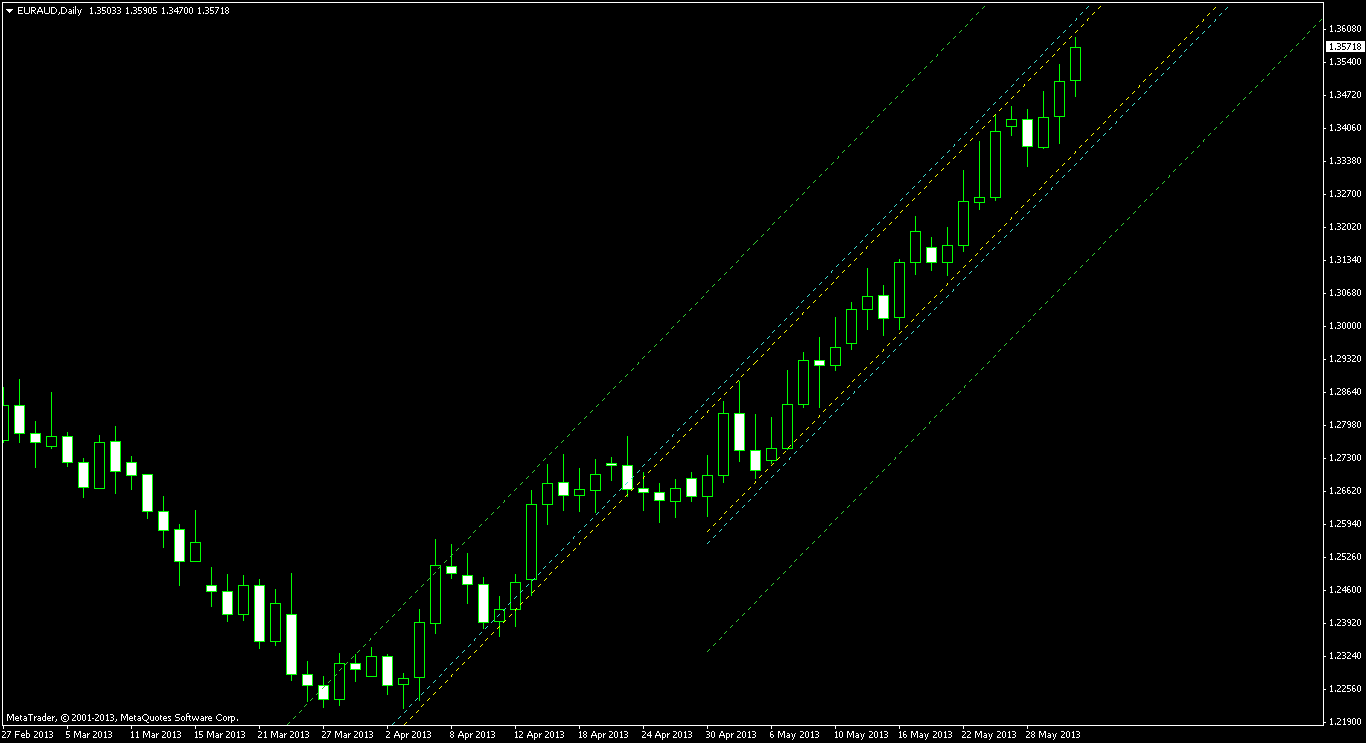
Today’s EUR/AUD pattern can be traced back to April 24, and the pair’s growth totals nearly 1,000 pips in that period. There have been numerous touches of both borders to confirm the validity of the channel. The biggest problem with this chart formation is that it does not follow a descending trend, whereas classical ascending channel is just a temporary correction for a bearish rally. Nevertheless, I will trade this pattern and will try to earn what little pips it has to offer.
As always, the pattern itself is marked using the yellow lines. The cyan lines represent the entry levels positioned at 10% of the channel’s height from the borders. The green lines represent the target levels positioned at 100% of the channel’s height from the borders. I will consider only bearish breakouts and will use the high of the breakout candle as my
stop-loss level. In case the breakout candle is traded mostly outside the yellow borders, the candle before the breakout one will be used for the
stop-loss.

Source:
http://www.earnforex.com/blog/euraud-a-really-long-ascending-channel-on-daily-chart/

No comments:
Post a Comment